


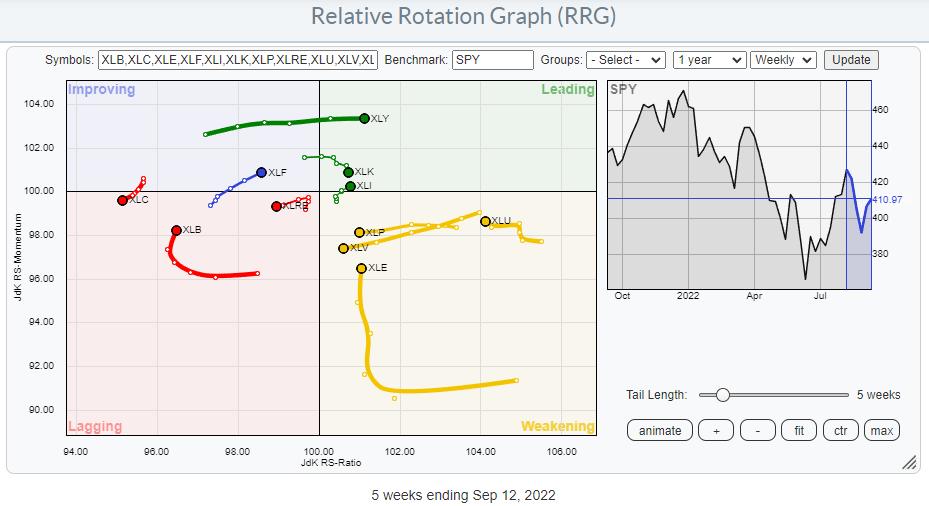
On the weekly Relative Rotation Graph, the consumer discretionary sector continues to improve and is now pushing further into the leading quadrant. It is now the sector with the highest JdK RS-Momentum reading. The tail length is fairly long compared to the other tails in the universe. All in all, a good (and improving) reading.
The current strength of this sector is confirmed on the daily RRG.
The tail for XLY is currently crossing back into the leading quadrant at a strong RRG heading, following a rotation through lagging in which the tail almost immediately started to rise on the RS-Momentum scale. The recent pickup of relative strength is now causing the curve to the right and into leading.
Weeding Through The Stocks That Make Up XLY
The Consumer Discretionary sector is a big sector both in terms of market capitalization as well as in the number of stocks that make up the sector.
The RRG above shows the top 50, of those 59, in terms of market capitalization. And the chart is showing an interesting picture.
What I find interesting is the fact that all tails inside the improving quadrant are traveling at a positive RRG-Heading. We may find some interesting charts with tradable opportunities in this group.
Inside the leading quadrant, F, ROST and CMG are showing strong rotations and are a bit ahead of the blue group inside improving. As far as we can eyeball on this chart, the dominant direction of the tails inside the weakening and the lagging quadrants is South-West, which means that these stocks are losing on both scales.
When I weed through the individual stocks and (de)select them based on the direction of their tails, I end up with the RRG chart below.
All these stocks are at a positive RRG-Heading, except for AMZN and TSLA. I added them to this graph because of their importance to the sector. Together, they make up 44% of the market cap of this sector.
Both AMZN and TSLA are at short tails inside the leading quadrant, and they are losing a bit of relative momentum. As they are the biggest weights in the sector, they are expected to remain close to the benchmark and, as long as the momentum loss does not get much stronger, they remain stable outperformers and can keep the sector up against SPY.
There are plenty of interesting charts among this group of stocks. Here are a few which I think are particularly interesting to watch.
CCL
CCL started testing support coming off the early 2020 low a few months ago. So far, this area around 7.5 has held up, which means that there is buying interest at these levels. Since the first bounce off that low, resistance has started to build up around 10.50. An upward break above that level will open up the way to the falling trendline that marks the upper boundary of the trend channel. The improving relative strength is certainly supporting such a move.
I do realize that the main trend is still down, but we are very close to important long-term support (7.5), which limits the downside risk for this setup. When CCL can reach the upper boundary of the channel and potentially break it, we could be looking at a very long-term turnaround that is starting to take shape.
CMG
The second chart I want to highlight is CMG. This one is interesting because of what, I think, could be a failed H&S pattern. In order to highlight what I mean, I have plotted the closing price as a thick line over the bar chart. In this way, we will be able to see the close line very clearly and still be aware of the highs and lows for each period. That move is now accelerating higher.
The left shoulder would be the peaks at the start of 2021, the head is formed in October 2021, and the right shoulder in Q1 of this year. The neckline connects the lows in between and was broken at the start of May. Initially, there was a bit of downward follow-through, but the pullback managed to break the double resistance coming from the old neckline, which was supposed to offer resistance as well as the falling trendline, opening up the way for more upside.
And we know that a failed H&S pattern is a strong signal for the continuation of the prevailing trend, i.e. upward.
ULTA
The third stock I want to highlight is ULTA. On the RRG, this stock had completed a long rotation through the leading quadrant before it sank into weakening at the end of July, around an RS-Ratio reading of 115 (=high in this universe). For two weeks now, the tail for ULTA has started to curl back up, which means that relative strength is gathering momentum again and pointing back up towards the leading quadrant. The strongest sign comes from the price chart, where we see ULTA breaking to new highs after a consolidation that lasted a year.
As long as the price can hold above the breakout level near 420, more upside is likely, which will undoubtedly pull that tail back towards the leading quadrant and make ULT one of the stronger stocks in this sector.
#StaySafe, –Julius