


There are so many charts at inflection points. Not just on a daily chart, but on 10-year time frames. For me, the larger market direction is at an important precipice; being involved or standing aside will be paramount to your wealth position heading into year-end.
XLY- Consumer Discretionary
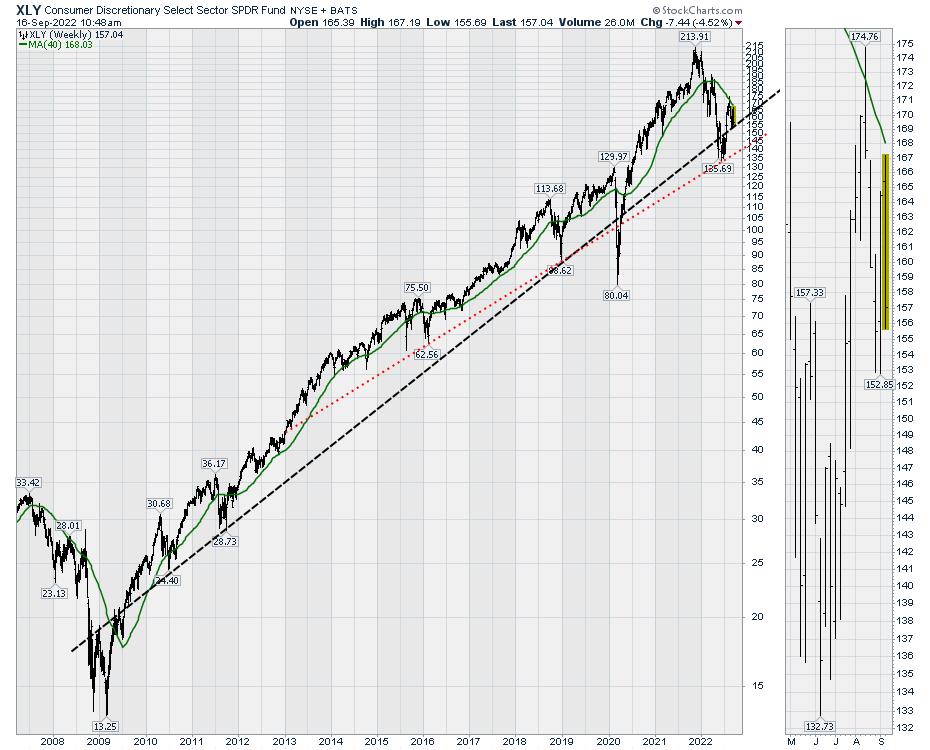
As an example, let me talk about the consumer discretionary sector (XLY).
Consumer discretionary is a popular investment sector. Many of the meme stocks are in this sector, with TSLA and AMZN as the behemoths. Retail names that swing in and out, like LULU and TPR, are in the sector.
The chart for consumer discretionary sits on a very relevant trend line. Going back to the 2010 period, XLY held a firm uptrend.
When COVID-19 came and went, stunning the industry by closing malls to foot traffic, the COVID-19 lows snapped long uptrends for many charts. But, more importantly, the charts rebounded quickly and got back above the long term trend lines. In early 2022, XLY broke the long uptrend for the second time.
After the June lows, the chart rallied. The August reversal has parked us on that line again. However, the chart has changed in character. Can you see it?
Notice the green line with a sharp downslope in the bottom left, which is also in the top right of the chart. After trying to rally back through the 40-week moving average, we are stalling. I think we have failed at trying to break through the green line, and now we risk breaking the 13-year uptrend line for the second time. The June drop found support at the 9-year-long red trend line. We have a little room to get back to that line.
As the consumer discretionary sector is slowing the pace of advancement (green line downtrending), it would be likely that a consumer discretionary chart is also going to be hit by a recessionary slowdown. If the long-term uptrend is broken (black) again and we end up moving to a more shallow uptrend (red), this is a significant longer-term change, as the green line is telling us.
Tesla
Looking directly at TSLA, the chart is the strongest of the top 6. The chart is making a series of lower highs, but pushed to trade back above the 40-week moving average this week. That is very bullish. In contrast, the PPO has a 2-year long downtrend in momentum, reflecting the flat price chart since January 2021.
The pivotal location on the chart is now. Can the PPO momentum break the two-year long downtrend? If so, the stock will start on its next leg higher. If the PPO rolls over below zero, this is typically where fast price drops occur. The strong Tesla price action over the last 5 days contrasts sharply with the weak index price action.
Amazon
The other behemoth is Amazon (AMZN). Looking at the PPO, Amazon seems to be one wave ahead of Tesla. When Amazon’s PPO rolled over below zero for the first time in March, the price move was a waterfall lower, losing 30% in a few months. To me, that is the precipice that the TSLA chart is on. This week, the Amazon chart is struggling to continue higher, and it looks like it wants to move lower. The PPO is starting to roll over again while below zero, suggesting a significant weakness. The failure at the green line above the price action suggests the downtrend is still intact.
Public Presentations
Being a technician watching charts requires following how the charts change from week to week. There is a lot happening next week; if you are interested, I will be presenting at three different public venues, as well as the regular weekly newsletter and video for clients!
The Pitch
I talked more about the macro environment on StockCharts TV’s The Pitch, and you can see that recording here:
The Pitch
I’ll also be presenting across a wide array of topics next week.
Osprey Strategic Approach
On Tuesday, I’ll be presenting on how the Osprey Strategic approach works to avoid the downside. You can register here for the live presentation on September 20th at 1PM ET.
Enhance Your Investment Mindset
Traders Exclusive
On Wednesday, see Traders Exclusive — September 21st at 1PM ET.
Wolf Financial
On Thursday I’ll be on a Twitter Space with Wolf Financial – September 19 at 3PM ET.
It is an important time to keep focused on how this market resolves itself. I have a bunch of things I’m watching and I’d be excited to provide some insights as to how we examine the markets. Try the various subscriptions available at OspreyStrategic.org for as low as $7.