


The week that went by remained much contradictory in nature; however this statement holds only if we look at with from different perspectives and different timeframes. The markets certainly remained highly volatile as they reacted to the reactions of the global markets to the 75 bps rate hike by the Fed on Wednesday. There are no second doubts about the kind of volatility that we witnessed this week. However, on the weekly time frame charts, it is just one more week of consolidation near the upper edge of the trading range with the breakout getting just delayed! The markets found themselves having oscillated in a 627.65 points range; despite this, the headline index NIFTY ended with just a loss of 203.50 points (-1.16%) on a weekly basis.
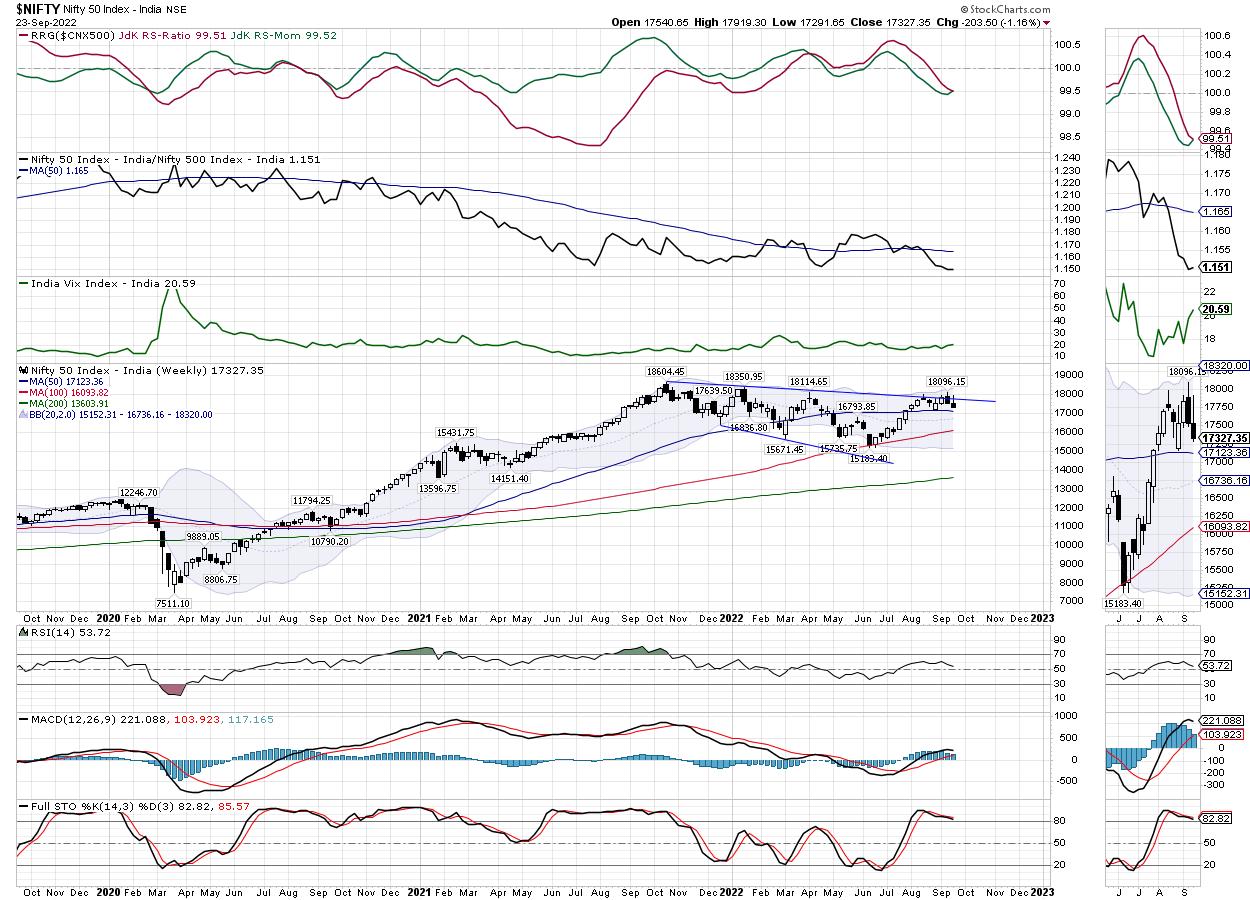
From a technical perspective, the levels of 50-Week MA are in focus again. The NIFTY has delayed its breakout from the falling trend line that begins from the lifetime high point of 18600 which joins the subsequent lower tops. The NIFTY has closed below this trend line pattern resistance; this makes the levels of 17700 a significant resistance point for the NIFTY. However, the focus is on the lower edge; the 50-Week MA is currently placed at 17125. This level is expected to play out as crucial support for the markets on a closing basis. It means that any major slip below this level on a closing basis will invite incremental weakness for the markets.
While we looked at the technical structure of the chart, we need to keep a few data points in mind as well. FIIs have been shorting the markets; as per the derivatives data, net shorts are being added in the last three sessions. As of now, the markets sit with large amounts of shorts in the system. The coming week is likely to see the levels of 17500 and 17650 acting as resistance points. The supports come in at 17100 and 16920 levels.
The weekly RSI is 53.71; it stays neutral and does not show any divergence against the price. The weekly MACD stays bullish and above its signal line.
The pattern analysis of the weekly charts shows that the NIFTY failed to achieve a breakout above the major pattern resistance that comes in form of a falling trend line. This trend line begins from the lifetime high levels of 18600 and joins the subsequent lower tops. The NIFTY has slipped near the 50-Week MA which presently stands at 17125; this level is expected to act as important support on a closing basis.
Regardless of the talks around us concerning fear of recession, the extent of the possible decline in the markets, and the kind of panic reactions the current decline may trigger, we need to approach the markets with a sane mind. It is strongly recommended that one must not resort to blindly shorting the markets given the extent of the shorts that exist in the system. On the other hand, so far as making purchases is concerned, one will need to stay highly selective in approach. While following the basics, it is strongly suggested that the highly leveraged positions must be avoided and overall exposures should be kept at modest levels. A short-covering from the lower levels cannot be ruled out as we head into the monthly derivatives expiry week. A cautious view is advised for the coming week.
Sector Analysis for the coming week
In our look at Relative Rotation Graphs®, we compared various sectors against CNX500 (NIFTY 500 Index), which represents over 95% of the free float market cap of all the stocks listed.
The analysis of Relative Rotation Graphs (RRG) continues to show NIFTY Financial Services, Banknifty, and PSU Bank indexes placed in the leading quadrant while maintaining their relative momentum against the broader markets. These pockets are likely to relatively outperform the markets. The Midcap 100 and Realty Index are also inside the leading quadrant; they too may outperform but they are also seen loosening up a bit on their relative momentum.
NIFTY Consumption, FMCG, and Auto Index continue to advance further inside the weakening quadrant.
While NIFTY Pharma continues to languish inside the lagging quadrant, the Energy, Media, Infrastructure, and PSE indexes also continue to stay inside the lagging quadrant. However, they also appear to be improving their relative momentum while staying inside this quadrant. This holds true for the IT Index as well.
NIFTY Metal index continues to stay firm inside the improving quadrant.
Important Note: RRG™ charts show the relative strength and momentum for a group of stocks. In the above Chart, they show relative performance against NIFTY500 Index (Broader Markets) and should not be used directly as buy or sell signals.
Milan Vaishnav, CMT, MSTA
Consulting Technical Analyst