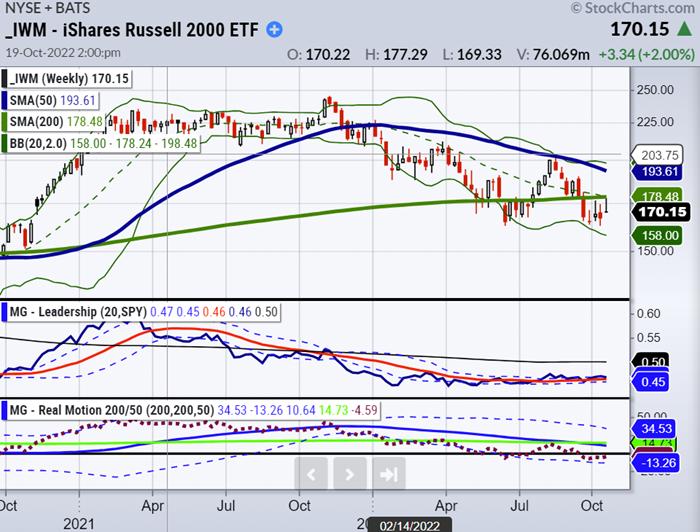
The Grandaddy Russell 2000 rallied close to its 200-week moving average (topic of our previous article) yesterday. On Wednesday, with rising yields once again, Gramps retreated.
In a bullish scenario, IWM continues to consolidate and rally in the coming days and weeks, eventually breaking through the 200-week moving average and continuing to climb. In the bearish case, if IWM cannot regain its 200-WMA after a period of consolidation, this key weekly technical level will become significant bear market resistance. That will most likely lead to lower lows.
IWM is in a bearish phase along with the other indices, but recent price action has shown relative strength. What should we watch out for?
While IWM struggles to break above its 200-week moving average, it has held its mid-June lows. SPY, DIA, and Nasdaq 100, all failed to do so.
Grandpa Russell’s companies are mid-cap and small-cap American businesses that are less well-known brands and have little exposure to international markets, so the strong US dollar has less impact. The Russell 2000 has violated the 200-weekly moving average several times before. In fact, with every crisis it was the NASDAQ that led while small caps remained weak. The reasons for that were low interest rates, low corporate tax rates and corporate buybacks. Small-cap companies did not have the same benefits from those factors.
In fact, this highlights the recent resilience of small and mid-cap stocks compared to large-cap stocks in the face of inflation, higher rates, slowing economic growth and US dollar strength. Grandpa Russell still needs substantial work to the upside, but a potential multi-week bottom might be forming.
Are you interested in trading small caps? Keep up to date with our analysis so you can enter and exit trades at the right time. You can sign up for a free consultation with Rob Quinn, our Chief Strategy Consultant, by clicking here to learn more about Mish’s top-rated risk management trading service.
Mish’s Upcoming Seminars
The Money Show: Join me and many wonderful speakers at the Money Show in Orlando, beginning October 30th running thru November 1st; spend Halloween with us!
Trader’s Summit: Mish speaks with Helene Meisler on October 23rd at 12pm ET. Learn more here.
Follow Mish on Twitter @marketminute for stock picks and more. Follow Mish on Instagram (mishschneider) for daily morning videos. To see updated media clips, click here.
Mish in the Media
Given mixed data, fear and strong earnings, the charts are the best indicators for the future of the economy, as Mish Schneider explains in this Yahoo! Finance appearance.
See Mish explain why Bond traders buy bad company stocks on Business First AM.
Read Mish’s latest article for CMC Markets, titled “Are Long-Term Treasuries Oversold?“.
Has the market bottomed? Where should passive investors go to be safe? Mish digs into these questions and more on Coast to Coast with Neil Cavuto.
Mish and Scott discuss a possible soft landing but with loads of headwinds to watch for on RFD-TV’s Cow Guy Close.
With BNN Bloomberg, Mish discusses the markets as U.S. banks reported earnings and why it’s important to watch long-term bonds and the stability investing in the sugar trade.
The 6-7 year business cycle in the “inside” sectors of the U.S. economy is facing a huge test, as Mish discusses on NASDAQ Talks.
Watch some select clips from Mish at ChartCon 2022!
Mish and Nicole talk risk, inflation, long bonds, dollar and where you can park some money on TD Ameritrade.
ETF Summary
S&P 500 (SPY): 360 pivotal support and resistance at 380. 362 caution; 360, 351, 340 upside 375, 380, 385Russell 2000 (IWM): 168 support, 173 support.Dow Jones (DIA): Continuing to hold 299 support; 308 resistance.Nasdaq (QQQ): 267 support, 274 resistance.Regional banks (KRE): 60 support, 64 resistance.Semiconductors (SMH): Support at 175 and resistance at 182.Transportation (IYT): Support at 202 with 208-210 resistance.Biotechnology (IBB): 115 support, 122 resistance.Retail (XRT): Long-term support at 55; resistance at 62.
Mish Schneider
MarketGauge.com
Director of Trading Research and Education
Wade Dawson
MarketGauge.com
Portfolio Manager


