Bruce Fraser joined me on The Final Bar this week and shared a thought-provoking point & figure chart of the S&P 500 index. With the recent upswing, you can use a horizontal count to identify potential upside targets for the bear market rally. (Yes, I am still labeling this a bear market rally. I’d encourage you to do the same!) But instead of running a point & figure chart for the S&P 500 index, we can also run point & figure charts for the entire 500 members of the index using our Bullish Percent Indexes.
Now it’s always easy to declare the perfect chart once you’ve seen its results during the course of a year. But, in this case, it’s a chart that’s part of our Mindful Investor Live ChartList for good reason!
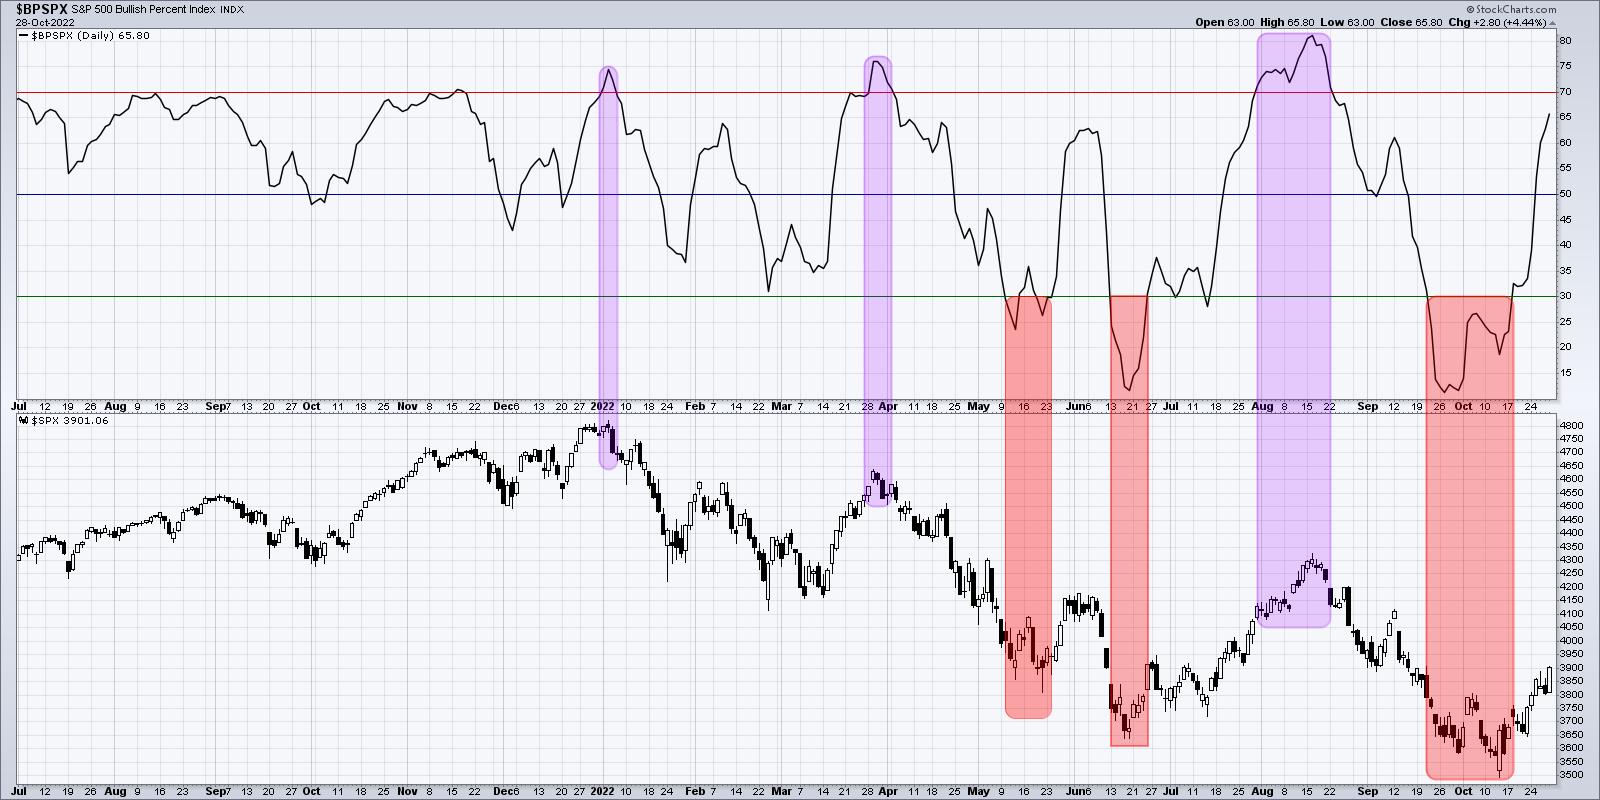
As of Friday’s close, 66% of the S&P 500 stocks have a buy signal on their point & figure charts. That’s up from around 10% in late September.
Notice the red-shaded areas on the chart, which indicate when the indicator has dipped below the 30% threshold. This happened in May (with a brief break back above 30% before the final breakout), in late June and in mid-October. These “buy” signals occurred just before fairly strong rallies into the June (about 7% from the May low) and August (a 17% rally) peaks.
Now note the purple-shaded areas, which indicate when we saw over 70% bullish readings. These regions coincide with the market peaks in January, March and August. As we pointed out to our Market Misbehavior premium members, the break above the 30% level last week indicated a high probability for a continued rise off the October low for the S&P 500.
So what’s next?
I’m looking for a break above the 70% level as this bear market rally continues. This strength in the Bullish Percent Index is similar to improving breadth conditions we’ve noticed across the board. At some point, however, we’ll most likely see this indicator rotate back below the 70% level. And if this truly is a bear market rally, then that signal could indicate an exhaustion of buyers and a likely retest of market lows!
RR#6,
Dave
P.S. Ready to upgrade your investment process? Check out my YouTube channel!
David Keller, CMT
Chief Market Strategist
StockCharts.com
Disclaimer: This blog is for educational purposes only and should not be construed as financial advice. The ideas and strategies should never be used without first assessing your own personal and financial situation, or without consulting a financial professional.
The author does not have a position in mentioned securities at the time of publication. Any opinions expressed herein are solely those of the author, and do not in any way represent the views or opinions of any other person or entity.


