


SPX Monitoring Purposes: Long SPX on 10/10/22 at 3612.39; sold 12/13/22 at 3669.91 = gain 1.59%.
Monitoring Purposes GOLD: Long GDX on 10/9/20 at 40.78.
Long Term SPX Monitor Purposes: Neutral.
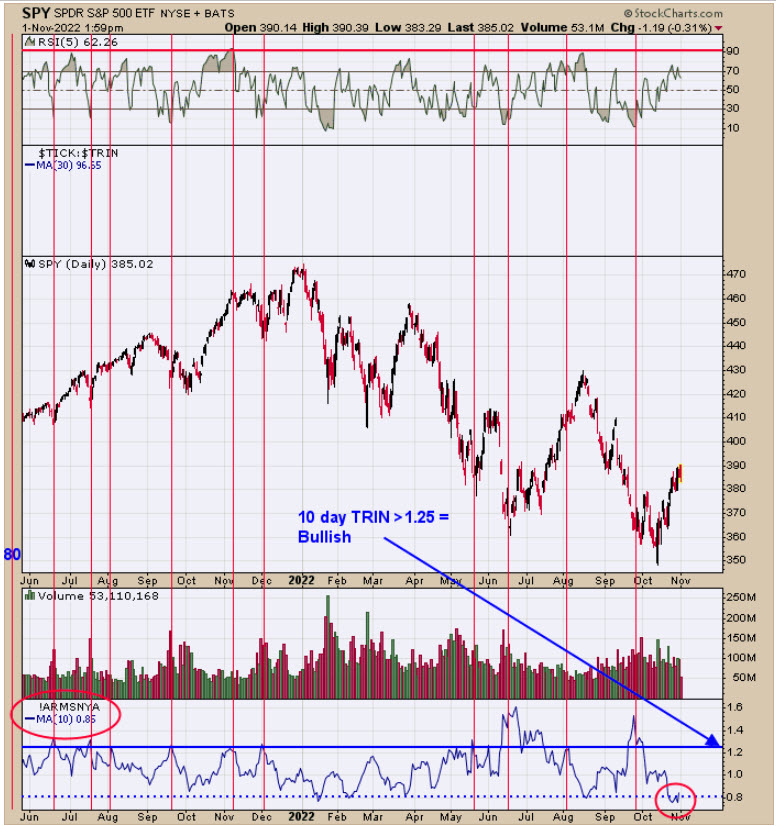
Intermediate-term lows have formed when the NYSE McClellan Summation Index falls below -700 (Check) and then rallies to +1000 in around two months. The Summation Index traded below -1000 on October 7 and stands at minus 654 yesterday; it would need to rally to +1000 around December 7, which is just a little over a month away. The 10-day TRIN closed yesterday at .85 (page 2) and is closer to a topping area than a bottom area. If the Summation index doesn’t reach +1000 by early to mid December, then, most likely, another decline is coming that may break to new lows. Things may change for the better if panic shows up near-term, and the election possibly could do that; if panic doesn’t show up, then it’s unlikely a rally will form and the Summation index will not reach +1000.
We have been showing that, when the 10-day TRIN closes <.80, the market usually at least stalls and, in a lot of cases. marks worthwhile highs. Recently, the 10-day TRIN low has been .75 and is the lowest reading on the chart above, which goes back to early 2021. We have reconfigured the 10-day TRIN to readings where bottoms in the SPY are found, which usually come in near 1.25 and higher (note with red vertical lines on chart above). The current 10-day TRIN comes in at .85 and more near a topping area than a bottom area. As we have said in the past, panic is needed for a rally to develop, and the TRIN above 1.30 shows panic is present. The more days above 1.30, the longer lasting the rally. Seasonality-wise, the most bullish month of the year is November. So we have a 10-day trin near bearish levels and bullish seasonal November; this fight of indicators may produce just a sideways pattern going forward, possibly into the election of November 8.
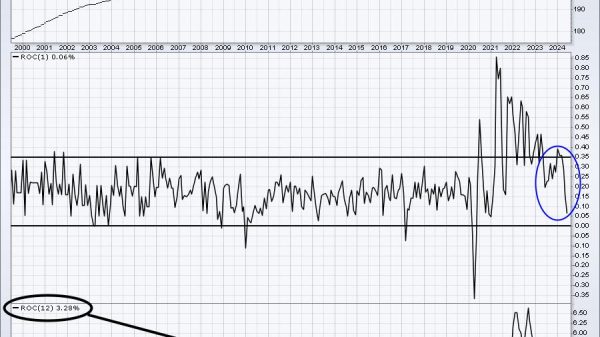
We have shown this chart in the past and have updated to current time. The middle window is the weekly HUI/Gold index and the window above is the RSI for the HUI/Gold index. Lower-term lows have formed when the weekly RSI for the HUI/Gold index falls below 30 and then turns up. The last signal came in late August. These types of signals are rare, occurring once every couple of years. There have been eleven signals since 2000, with one failure in 2013 which works out to 91% success rate. The 10 signals that did work out where all longer-term buy signals which some last several years.
Tim Ord,
Editor
www.ord-oracle.com. Book release “The Secret Science of Price and Volume” by Timothy Ord, buy at www.Amazon.com.