


Price pattern analogues are fun to find and track, as long as one understands that the correlation is never going to be absolutely perfect. And the additional point that must be understood is that every pattern analogue breaks correlation eventually — they most often do so at a point in time when you are most counting on them to keep working.
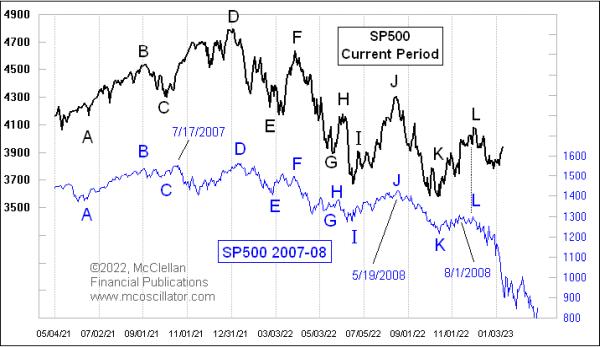
This week’s chart shows a pretty thorough breaking of correlation with a prior pattern, in this case the bear market of 2007-09. It has been working nicely throughout 2022. The letters in the chart are just a means of identifying points of similarity between the two price plots. The correlation of the two patterns was a little bit weaker in the beginning, at the left end of the chart, but got tighter as 2022 wore on.
If the stock market in 2023 was going to continue following this pattern analogue, then we should be seeing a sharp decline right now, the echo of the stock market’s drop in September 2008 occasioned by the collapse of Lehman Brothers. Instead, the stock market is showing nice strength in January 2023, setting up hopes for the “January Barometer” to indicate a bullish year. That omen of stock market behavior has some statistical problems, as I detailed here back in 2019.
But people can still believe in something which the statistics do not support, and that can create market excitement for a while. Whatever the source of the new strength, and whatever its long term meaning might be, the strength we are seeing now in January 2023 is a definite break from the 2008 pattern, and so we can file this one away as a pattern analogue that was fun while it lasted, but which has broken its correlation and should not be expected to work any more going forward.
As a final note, one of the ways that an analogue can start to break correlation is that we may see the patterns invert, still matching the timing of the dance steps of the prior pattern, but doing so inversely. It may be that we are seeing that now. But any pattern which is fickle enough to invert its correlation is also fickle enough to disinvert without notice, so one should not count on that performance in this case.