


Natural Gas use has become a hot button in the United States as bans begin to be discussed or enacted in certain states and cities. Whether you believe this is good or bad, it is news. A subscriber recently asked us to review Natural Gas (UNG) . Today seems a good day to do just that given its giant -6.48% decline.
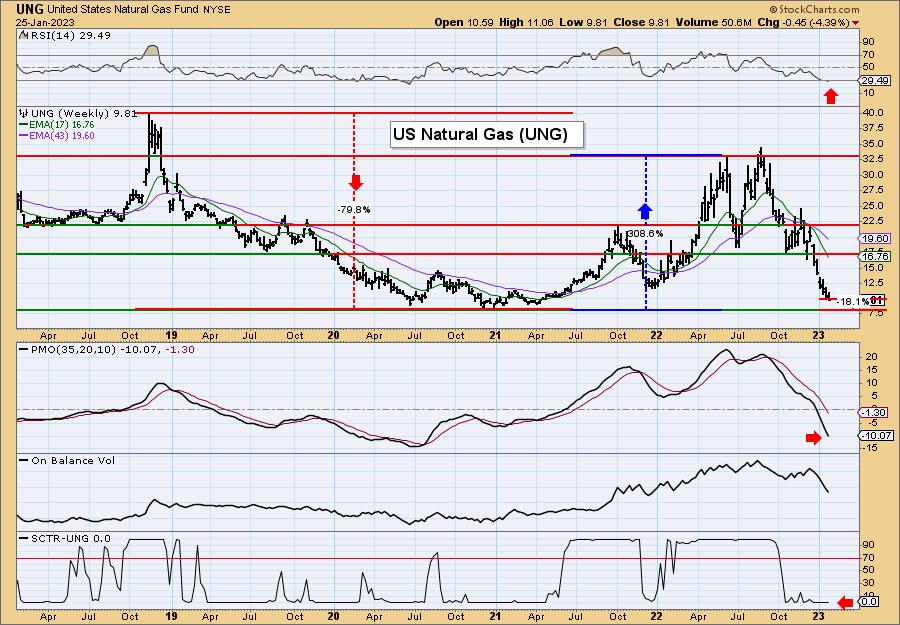
We doubt that the news is causing problems for UNG. It doesn’t matter. The technicals on the weekly chart look terrible. Price dropped more than 79% from the 2018 high to the all-time low. On the flip side, it rallied over 300% out of that all-time low. All-time lows are about to be reached. More than likely our subscriber is eyeing this one on thoughts of getting in on a possible big gain when it reverses. We get it, but beware, it still has another 18% it can decline before reaching all-time lows.
Unfortunately there is no good news on the technical horizon. The weekly RSI is now below 20. It’s oversold, but it is still retreating. The weekly PMO is now in oversold territory, but is showing no signs of a reversal ahead. Worse yet, the StockCharts Technical Rank (SCTR) is at 0%. This means there are no ETFs worse than this one. It is the worst.
Conclusion: Natural Gas (UNG) is about to reach all-time lows. However, it isn’t a reversal candidate yet. The indicators are terrible and apparently as far as the StockCharts Technical Rank is concerned, there are no worse ETFs. Keep it on the watch list or subscribe to the DecisionPoint.com Bundle! We have it on our watch list and will notify you when it begins to look interesting on a reversal based on our indicators. Use coupon code: SAVE50 and get 50% off your first month!
Watch the latest episode of DecisionPoint on StockCharts TV’s YouTube channel here!
Technical Analysis is a windsock, not a crystal ball. –Carl Swenlin
(c) Copyright 2023 DecisionPoint.com
Helpful DecisionPoint Links:
DecisionPoint Alert Chart List
DecisionPoint Golden Cross/Silver Cross Index Chart List
DecisionPoint Sector Chart List
Price Momentum Oscillator (PMO)
Swenlin Trading Oscillators (STO-B and STO-V)
DecisionPoint is not a registered investment advisor. Investment and trading decisions are solely your responsibility. DecisionPoint newsletters, blogs or website materials should NOT be interpreted as a recommendation or solicitation to buy or sell any security or to take any specific action.