


Everybody is talking about breadth lately. And, indeed we see or have seen some improvement in New Highs / New Lows, A/D lines, New 52-Week Highs, etc.
As you may, or may not, know, I use Relative Rotation Graphs to visualize market breadth as well from time to time. There are two ways we can do that.
Plotting Percentage of Stocks Above 20-, 50-, & 200-EMA
The first way is to use the indexes that measure the percentage of stocks above a moving average. On StockCharts.com, we keep track of those numbers in a family of indices that start with !GT##XXX, where ## is the number of days of the Exponential Moving Average. This can be 20-, 50-, or 200-days. The XXX holds the symbol for the sector; see it as a measure of market breadth at sector level.
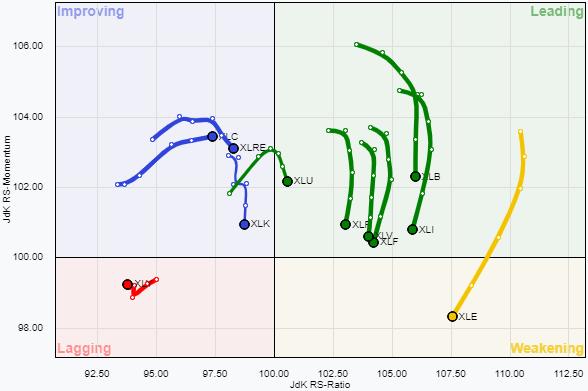
The RRG above shows this rotation for the EMA-20 indices, comparing it against the percentage of stocks above their 20-day EMA in the S&P 500. The recent strength is visible, with the majority of sectors on the right-hand side of the graph, while only the three defensive sectors are positioned inside the lagging quadrant.
But when we look a bit closer, we can see that only the three sectors inside the green oval, Materials, Technology, and Real-Estate, are still moving higher on the RS-Ratio scale, which means that they are strengthening against !GT20SPX. All sectors inside the yellow oval are losing strength, while the three defensive inside lagging have stopped going down.
The one thing that you’ve got to keep in mind using this setup is that the values for these indices are contained between 0-100. So, when one of these extremes is reached and the index remains level at that extreme, RS-Momentum will taper off by definition while RS-Ratio continues higher, but, eventually, RS-Ratio will also come down. As long as the trend for these numbers is still up, it will not go below 100.
The second chart shows the same image, but now uses the 50-day EMA percentages. As you can see, the universe is now a bit more spread out, with Materials at 93.10% while Staples has only 18.18% of stocks above its 50-day EMA. Only Materials and Energy have a positive RRG-Heading, and Technology and Real-Estate are still moving higher on the RS-Ratio scale. Inside the lagging quadrant, we now also find Industrials.