


Since late 2021, value stocks have been dominating Growth. The $DJUSGR:$SJUSVA ratio rode the way down together with $SPX. I highlighted this development in a few articles back in 2022.
At the moment, that situation seems to be reversing.
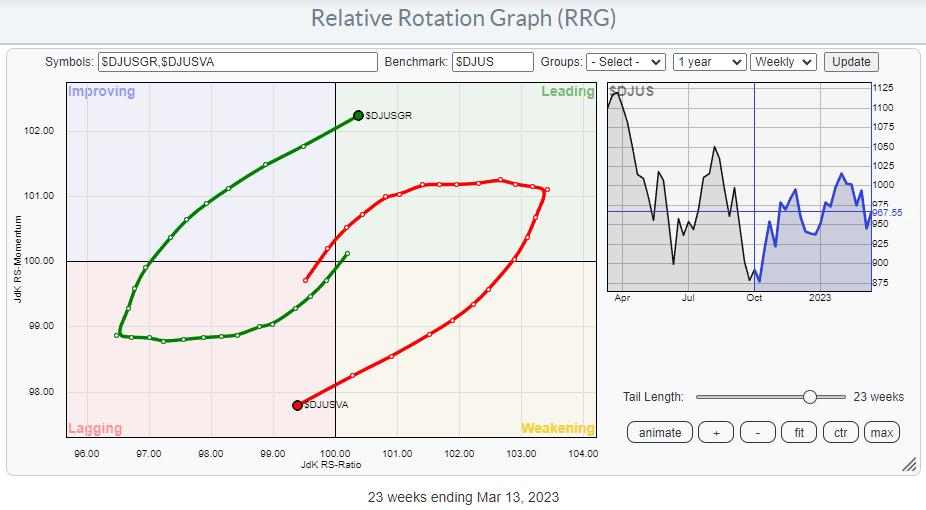
The Relative Rotation Graph above shows the Growth Value rotation on the weekly time frame, with Growth crossing over into the leading quadrant while value moves into lagging.
The rotation on the daily RRG underscores this rotation as it shows how the Growth tail is completing a rotation from leading through weakening and back into leading, getting back in line with the weekly tail. A similar rotation has occurred on the opposite side, with value rotating through improving and now back into lagging.
This means that Growth is now advancing on both RRG axes on both the weekly and the daily time frames.
Adding the Monthly Rotation
Finally, when I bring in the monthly RRG of this comparison.
It becomes visible that the tails have just started to rotate. Value has rolled over inside leading while Growth is curling up inside lagging.
Putting all this together suggests a more significant rotation back to growth stocks is underway.
The 1-1 Ratio Chart is Confirming
Above is the updated version of the 1-1 comparison chart for Growth vs. Value I have used in the last two years.
The big double top is clearly visible. But what’s also interesting is that the price target, based on this double top, was reached almost to the dot. This target coincided with support offered by old highs formed in 2018-2019. A strong rally in favor of Growth is now emerging from this freshly created low.
For this occasion, I have added the RSI (9) and MACD indicators below the plot to point out the positive divergences that have formed between the ratio and these indicators over the last year.
These setups confirm the rotational behavior as seen on the Relative Rotation Graphs.
The Ultimate Growth Universe
The NY FANG+ Index is probably the ultimate growth universe.
Plotting the universe against $ONE clearly shows the general strength of these stocks. Except for NFLX, all are traveling at a strong RRG Heading and inside the leading quadrant or inside, improving and moving towards leading.
Bringing in the $NYFANG index as the benchmark changes the image. First of all, it is now a closed universe, meaning that all index members are on the plot. This enables us to find the strongest and weakest stocks in the universe.
For this occasion, I want to focus on two tails inside the leading quadrant and moving at a strong RRG-Heading; NVDA and AMD.
NVDA
From a relative perspective, however, NVDA is just breaking to new highs against $NYFANG, making it an interesting stock to hold to outperform that index.
NVDA is already well underway on the price chart after completing an H&S reversal in the first weeks of 2023. It is now getting closer to overhead resistance in the range around 280, with support only showing up around the breakout area, making it look like a risky trade from a price perspective right now.
The daily chart shows that over the last few weeks, resistance was built up around 240, and yesterday’s (Thursday, 3/16) jump took NVDA above that resistance level, making it support in the days/weeks to come. Hence from a (shorter-term) trading perspective, this area can be used as a stop-loss level.
AMD
AMD is lagging behind the move, as seen in NVDA on the price chart and the RRG. The good news is that there is probably a bit more upside left to capture in AMD.
On the RRG, AMD has only just crossed into the leading quadrant, while NVDA has the highest JdK RS-Ratio reading in this universe.
On the price chart, AMD is now underway to the next resistance area near 105, while relative strength is about to break its previous high and improve further, targeting the relative highs of 2021 and 2022.
Running the daily RRG for the $NYFANG universe makes this even more apparent. AMD is inside, leading and moving further into it, while NVDA has just rolled over into weakening and seems to be taking a break.
For those who like to trade short-term and a bit more aggressively. Pairing AMD against NVDA could be an interesting combination to watch!
#StayAlert and have a great weekend, –Julius