


With the first quarter of 2023 drawing to a close, what impresses me most about the equity markets are the improving breadth conditions. While the markets can move higher on strength from the MANAMANA stocks, sustained bull market phases usually need additional support from other stocks.
One could argue that stocks like MSFT and AAPL represent enough market cap that they can single-handedly drive the benchmarks higher, and that is arguably what we saw earlier in March. But, by this Friday’s close, improving breadth conditions indicate that it’s not just the FAANG stocks anymore. This is a broad advance with an opportunity to push well above S&P 4100.
Why SPX 4100 Matters
The S&P 500 ended the quarter around 4110. That is right about the same level where the SPX was at six weeks ago. And the same level as four months ago. And also seven months ago. And eleven months ago. That’s right, our most followed benchmark is at the same place it was almost one full year ago, in the bear market phase of 2022.
So with all of the uncertainty, all the volatility, and plenty of upside and downside catalysts, the overall market trend has been sideways for almost a year!
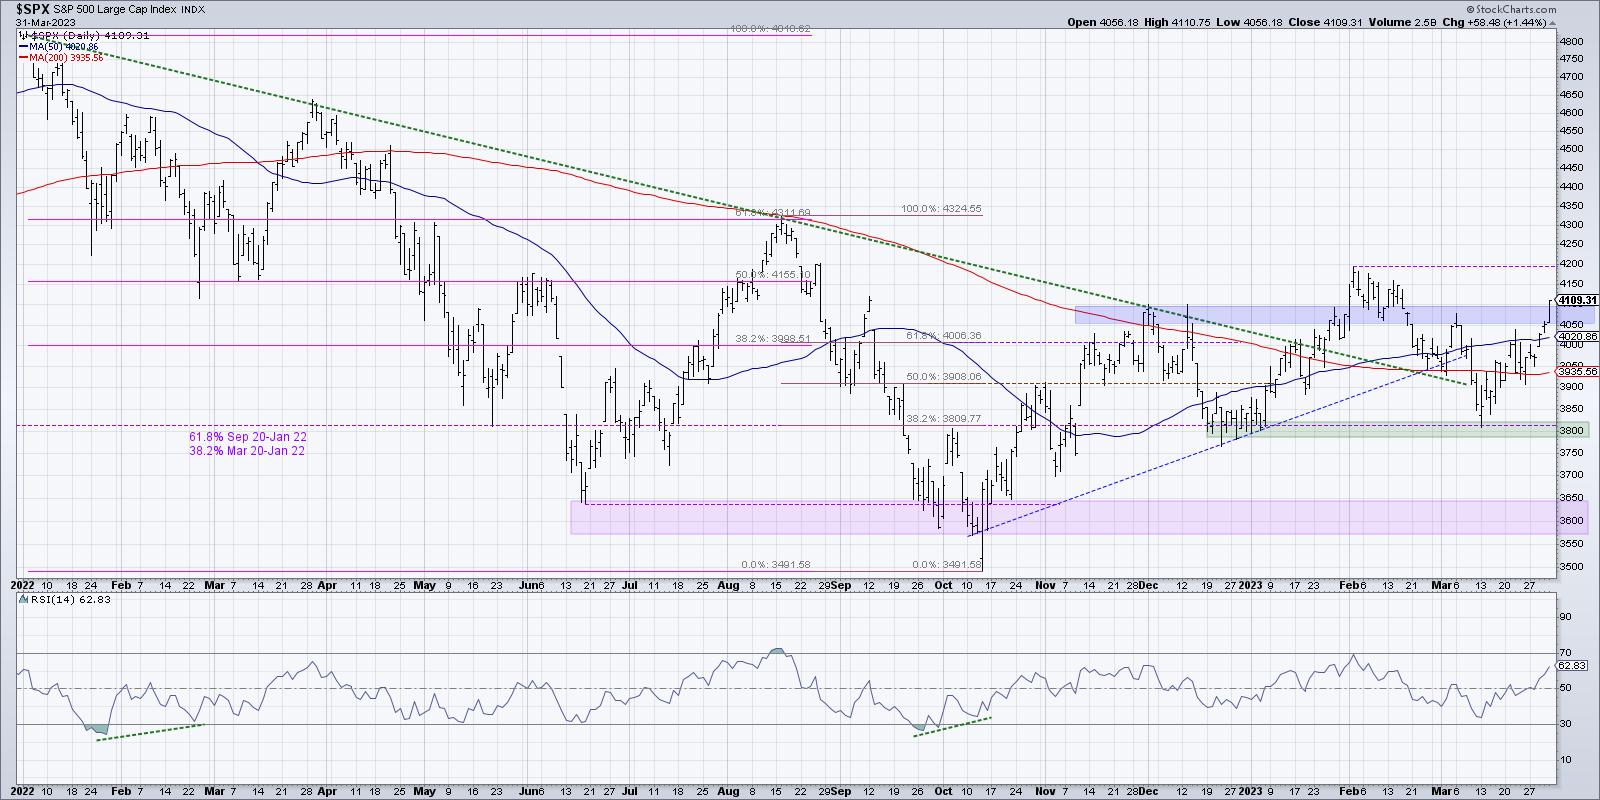
When a market becomes rangebound, I find it helpful to use a “stoplight” approach, using support and resistance levels. At what level would the market look bullish if it reached above? And what level would need to be broken on the downside to confirm a bearish phase? Anything in between remains in the neutral category.
The 4100 level became extra significant in November, as it represented the first big up thrust off the October low. I see the February breakout as a failed breakout above that established resistance level.
Once again, we are testing resistance at 4100. Will the S&P 500 have enough upside momentum to power through this level to 4200 and beyond? It will need to be driven by not just the FAANG stocks, but by other names, represented by the ETFs listed below!
The Continued Strength of Technology
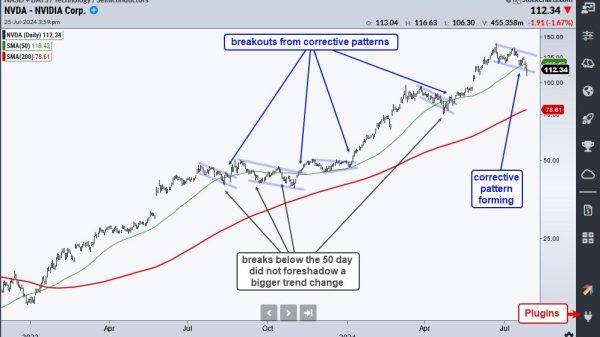
While semiconductors have been one of the strongest groups around, driven by solid charts like NVDA, I was impressed to see the Video Gaming and eSports ETF (ESPO) on my new swing highs list this week.
What’s really interesting about this ETF, besides the fact that it demonstrates a clear bullish bias with rising price and relative strength, is that two of its top five holdings are semiconductors! That’s right, NVDA and AMD are both top holdings in this ETF. Another great reminder of the value of due diligence on ETFs to be clear on what stocks are included!
But the strength in ESPO is not just due to the semiconductor holdings. Stocks like EA and ATVI have started to breakout to the upside, pushing above established bases and indicating a new bull phase in progress.
Non-US markets have benefitted from a weaker US Dollar, so I was not surprised to see a number of European equity ETFs in the top decile of our SCTR ETF rankings. Germany, France, Spain, Ireland, and Denmark are all toward the top of the entire iShares family of ETFs this week.
Here’s a pan-European ETF which is back to testing resistance around $50. Note the higher low in mid-March, the upward-sloping 200-day moving average, and the RSI, which bottomed out recently around 40. These are all signs of a bullish trend phase.
Participation From Lagging Sectors
Perhaps the most convincing bullish argument here comes from the improvement in charts of sectors like financials, which have been lagging behind the FAANG sectors. The XLF rallied into the weekend after bouncing off support in the $30-31 range.
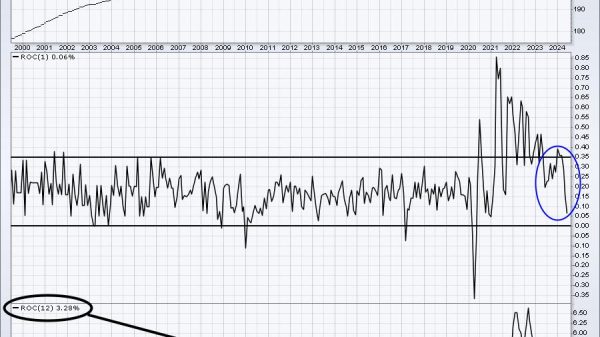
I’ve added the PPO indicator on this chart to illustrate how the recent rally could be another rally phase similar to previous recoveries off the lows. Bottoms in June and October of last year were soon followed by PPO buy signals as buyers bought in on price weakness. Charts like the XLF moving higher in April could provide the additional upside momentum for our equity benchmarks, as some of the beaten-down sectors are seeing additional demand as well.
Given the inverted yield curve, the uncertainty of the 2023 financial crisis, and recessionary risks, significant upside for stocks seems unlikely. But for now, the charts are telling me that a broad advance is in place and S&P 4100 may be just the beginning.
What do you see coming next for the S&P 500? In my latest video, I break down four potential scenarios and the technical and macro implications for each. Which do you see as most likely, and why?
RR#6,
Dave
P.S. Ready to upgrade your investment process? Check out my free behavioral investing course!
David Keller, CMT
Chief Market Strategist
StockCharts.com
Disclaimer: This blog is for educational purposes only and should not be construed as financial advice. The ideas and strategies should never be used without first assessing your own personal and financial situation, or without consulting a financial professional.
The author does not have a position in mentioned securities at the time of publication. Any opinions expressed herein are solely those of the author and do not in any way represent the views or opinions of any other person or entity.