


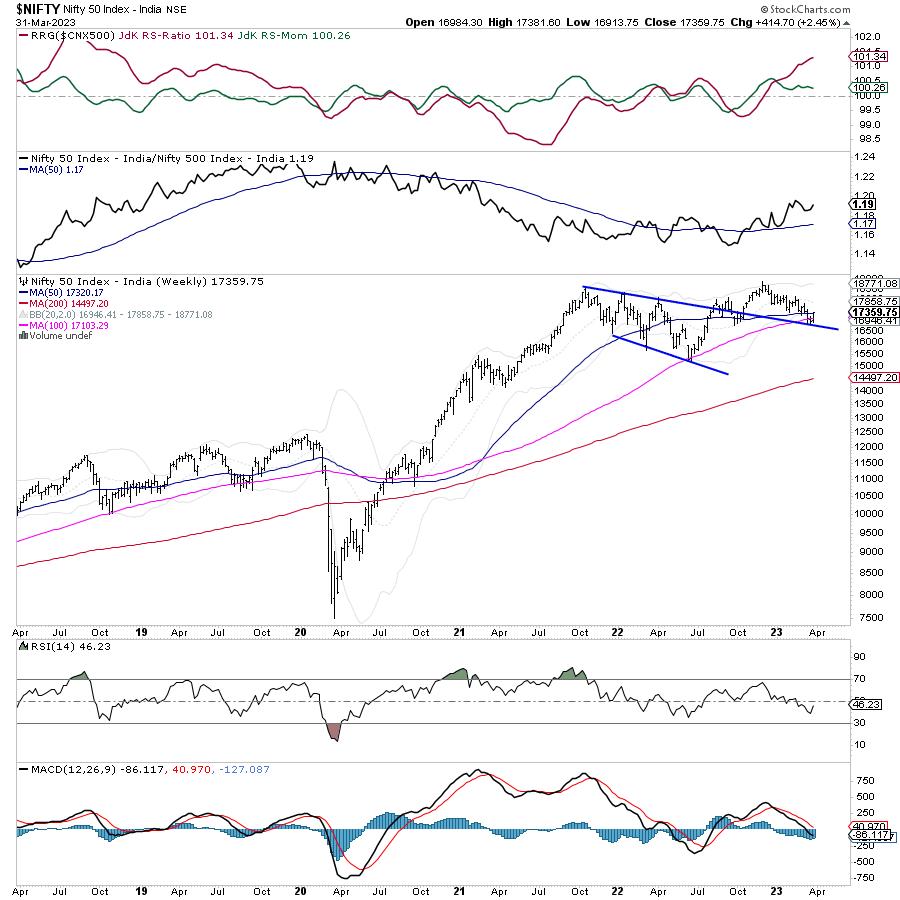
The markets had a positive weekly closing; despite the truncated week with just four trading sessions, the NIFTY registered decent gains. Over the past many sessions, the markets were unable to take any major directional calls; however, this week saw the markets rebounding from the lower edge of the trading zone on the back of heavy short covering from the lower levels. The trading range got a bit wider; the index moved in a range of 467.85 points over the past four sessions. A few important supports were defended on the weekly charts; the headling index closed with a decent gain of 414.70 points (+2.45%) on a weekly basis.
While the week that has gone by was a truncated one, the coming week is even shorter. We just have three trading days in the coming week; Tuesday and Friday are trading holidays on account of Mahavir Jayanti and Good Friday.
This week remains important from many technical perspectives. The NIFTY defended the 100-Week MA as a support on a closing basis; it has also closed a notch higher above its 50-Week MA. The 100-, and 50-Week MAs are currently placed at 17104 and 17320 respectively. Besides this, the index has also defended the pattern support that exists in the form of a falling trend line. The strong up-move that has come on the last trading day of the week has been fueled by a short covering-led rally; this is evident as the NIFTY Futures have shown a decline in Net OI along with the rise.
Another thing that again raises caution is a very sharp decline in volatility. INDIAVIX came off by 15.12% to 12.94; this warrants a high degree of caution while we follow any further moves in the markets. Monday is likely to see a quiet start to the day; the levels of 17450 and 17530 are likely to act as resistance points. The supports come in at 17180 and 17000 levels. The trading range will continue to stay wider than usual.
The weekly RSI is 46.23; it stays neutral and does not show any divergence against the price. The weekly MACD is bullish and stays below the signal line. PPO remains negative.
The pattern analysis of the weekly charts shows that the NIFTY has taken support on the falling trend line pattern resistance. This falling trend line begins from the high of 18604 and joins the subsequent lower tops while extending itself. Apart from this, the Index has also defended the 100-Week MA which is placed at 17104, and has closed just above the 50-Week MA which is at 17320 levels. This has redefined the trading zone for the NIFTY between 16900-17500; unless either of these levels is taken out or violated, we will see the index oscillating in this range.
As we approach the coming week and follow the extension of the up move, if any, we will need to keep in mind that the Options data suggest the markets facing resistance at 17500 levels. Besides this, we will need to keep a very keen eye on the VIX; consistently low levels of the INDIAVIX will keep the market participants exposed to violent profit-taking bouts from higher levels. While we navigate this technical phase of the markets, we will need to keep approaching the markets on a highly cautious and selective note. While keeping leveraged exposures at modest levels, a cautious outlook is advised for the day.
Sector Analysis for the coming week
In our look at Relative Rotation Graphs®, we compared various sectors against CNX500 (NIFTY 500 Index), which represents over 95% of the free float market cap of all the stocks listed
The analysis of Relative Rotation Graphs (RRG) shows Nifty Mid-cap 100, FMCG, PSE, and Infrastructure indexes in the leading quadrant. These groups are likely to relatively outperform the broader markets. The NIFTY Auto and IT sector indexes are also inside the leading quadrant but they appear to be giving up on their relative momentum.
NIFTY Financial Services Index is inside the weakening quadrant but it is seen improving its relative momentum. Besides this, Banknifty and PSU Bank index continue to roll inside the weakening quadrant.
NIFTY Metal has advanced further inside the lagging quadrant. They may cause this index to relatively underperform the broader markets along with the Energy Sector index which is also languishing inside the lagging quadrant. Media Index is also inside the lagging quadrant but it is seen attempting to better its relative momentum against the broader markets.
The Realty Index has mildly rolled inside the improving quadrant; the Pharma index is also seen struggling to keep up with its relative momentum which is fast declining. The Consumption index is inside the improving quadrant as well; it is seen rolling firmly in the northeast direction towards the leading quadrant. This group is likely to show resilient performance over the coming days.
Important Note: RRG™ charts show the relative strength and momentum of a group of stocks. In the above Chart, they show relative performance against NIFTY500 Index (Broader Markets) and should not be used directly as buy or sell signals.
Milan Vaishnav, CMT, MSTA
Consulting Technical Analyst