


The NYSE FANG+ index $NYFANG holds ten of the largest stocks in the US.
Alphabet – GOOGLSnowflake – SNOWMETA Platforms – METANVIDIA Corp – NVDAAmazon – AMZNMicrosoft – MSFTAdvanced Micro Devices – AMDApple – AAPLNetflix – NFLXTesla – TSLA
The index is equally weighted, so around 10% for each stock.
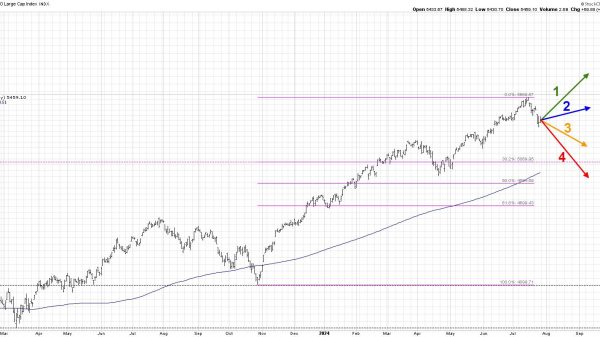
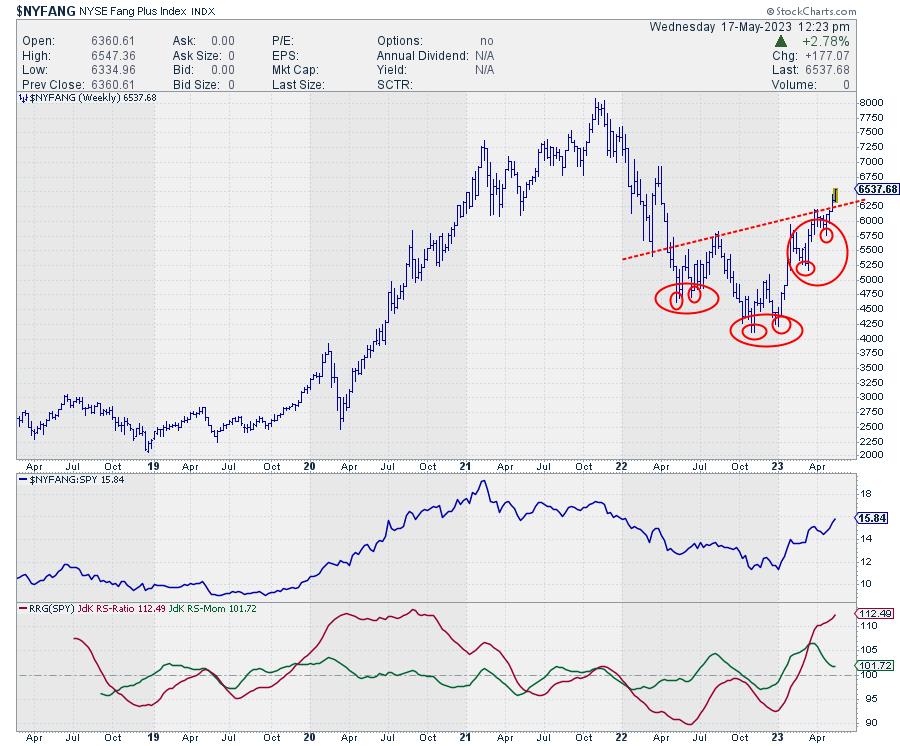
The price chart of the NYFANG+ index is characterized by a large complex H&S reversal pattern which was executed last week as the price broke above the up-sloping neckline.
Based on this formation, a price target for the index can be calculated at around 8000, which matches with the all-time high for the index set at the end of 2021.
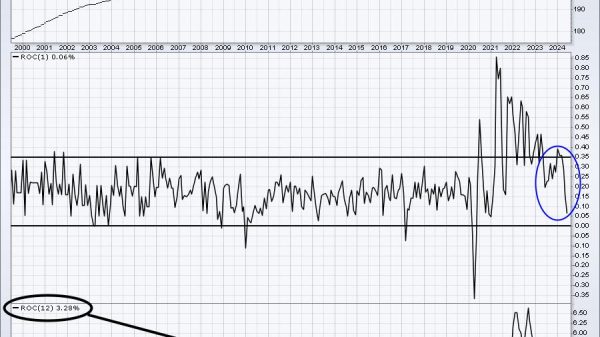
From a relative perspective, the NYFANG index leaves the S&P 500 far behind and is steaming ahead to further outperformance.
The members come from three different sectors. Technology, Consumer Discretionary, and Communication Services. And all stocks are in the S&P 500 index except for SNOW.
Measured against $SPX
The first RRG for this universe uses $SPX as the benchmark. It clearly shows the strength of this group of stocks as a whole. All of them are on the right-hand (strong) side of the graph.
The strongest trajectories are found for GOOGL, AMZN, SNOW, and NFLX. The first three are either inside improving or leading and at a strong RRG-Heading. NFLX is inside the weakening quadrant but has just turned back up and is now rotating toward leading again at a strong heading.
META, NVDA, and AMD are all losing relative momentum but are still at high Jdk RS-Ratio readings, which suggests that they are merely going through a temporary setback rather than a turnaround of the relative uptrend.
The only weak(er) stock in this group is TSLA, which is moving straight down on the JdK RS-Momentum scale and more or less exactly at the 100-level on the RS-Ratio axis.
NYFANG as a Closed Universe
Plotting the same group against $NYFANG as the benchmark creates a so-called closed universe. This means that all stocks plotted on the graph are included in the benchmark. This gives a better insight into the (real) relative strength of the individual stocks against their peers in the universe.
The same names pop up as strong. No surprise there, but we are getting a better handle on their relative position vis-a-vis each other.
AMD, META, and NVDA are still strong and on the right-hand side of the graph but clearly hoping through a setback.
TSLA is now clearly the weakest member of this group as it is rotating into the lagging quadrant from improving at a long (strong momentum) tail.
AAPL seems to be halting its progress, but the other tails inside the improving quadrant continue to look promising.
Zooming in on Daily Time Frame
To further fine-tune the analysis, I’d like to look at the daily RRG to see whether the rotations on the weekly are getting any confirmation or follow-through on the shorter time frame.
On this daily RRG, AMZN, GOOGL, and SNOW confirm the strength seen for these stocks on the weekly RRG. This makes them potential buying candidates.
GOOGL
This is probably the least interesting stock from a risk/reward point of view. After breaking above its horizontal resistance at 109, GOOGL rallied sharply and is now nearing its next overhead barrier between 122.5-125. Therefore, limited upside potential to the next resistance level, while there is more risk toward the support level.
The rotation on the RRG is strong, but overhead price resistance is looming. Only when GOOGL takes out 125, new upside potential becomes available while at the same time limiting risk as 125 will then start to act as support.
AMZN
The rotation of the tail for AMZN on the daily RRG is not very well visible. When you open up this RRG in your own account and highlight AMZN, you will see that it has just turned back up after a rotation through weakening, and is now heading up toward the leading quadrant again.
Combined with the strong trajectory on the weekly RRG and the upward break on the price chart, AMZN shows an interesting setup with upward potential to the last major peak, around 145.
I wrote about AMZN in this article recently. The analysis presented here still stands.
SNOW
SNOW ended up in a large triangle consolidation after dropping from 400 back to 120 in less than six months’ time. It looks like the market has absorbed all this supply, and last week SNOW broke above its most recent high and out of that large triangle formation. This is definitely a good sign.
On the weekly RRG, SNOW is inside the improving quadrant but at the lowest RS-Ratio reading. On the daily RRG, SNOW pushes deeper into leading and is at the highest RS-Ratio reading. This combination of rotations, together with the upward break in price, means that the outlook is strong. When the tail on the daily RRG rolls over, that will most likely signal the start of the first correction after the break, which will very likely offer good new entry opportunities.
#StayAlert, –Julius