


What compels me to write a bold headline claiming one sector is obviously poised to break out to the upside?
As a trend follower, I have three goals every day: identify trends, follow those trends, and anticipate when those trends may reverse. Simple, right?
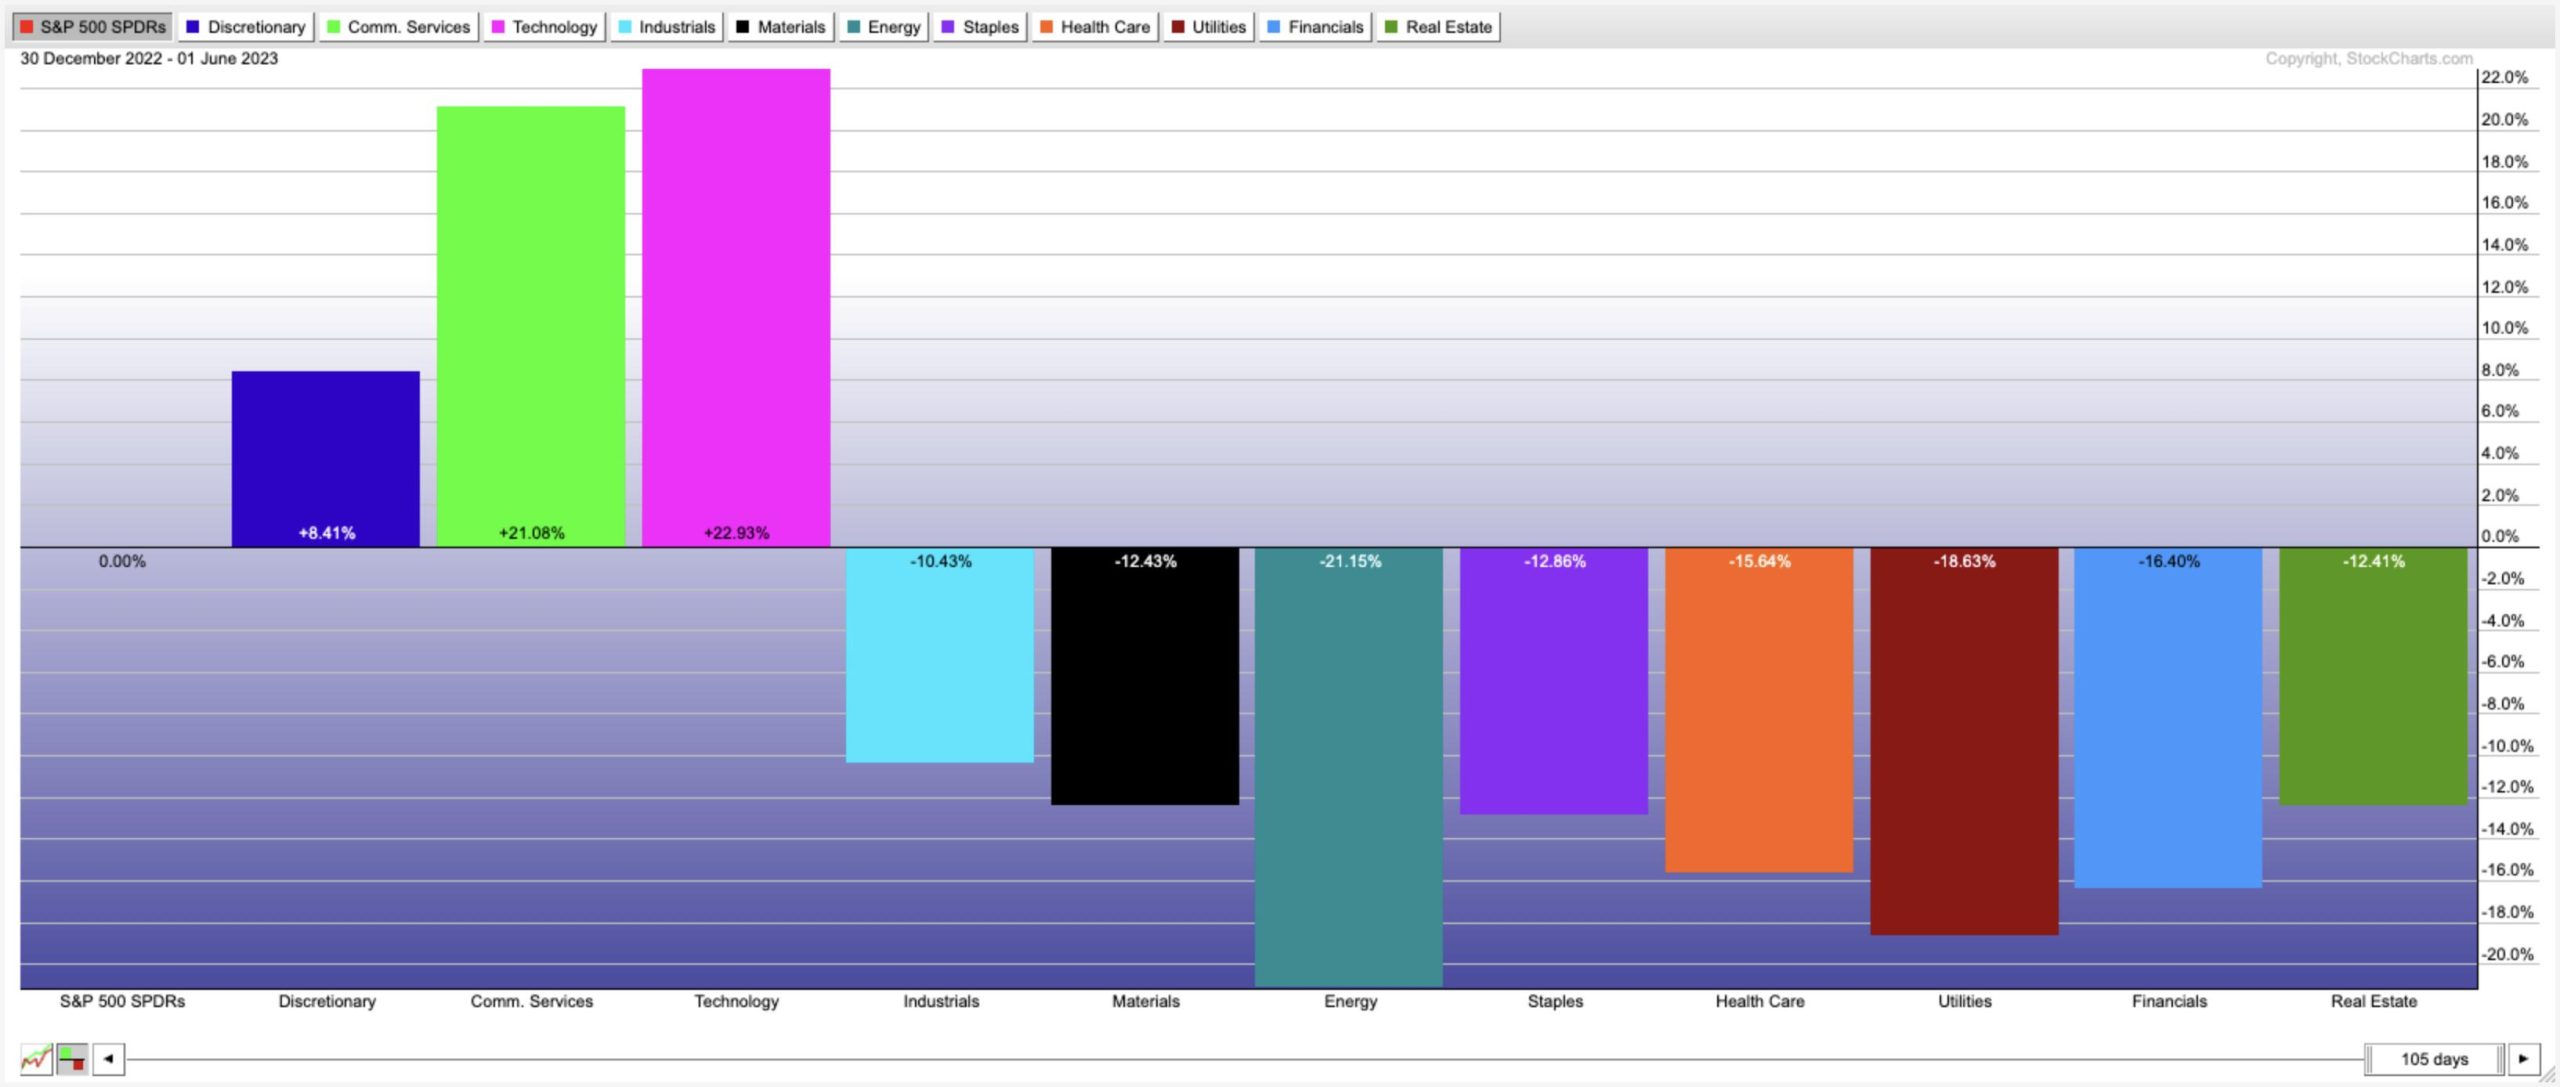
Energy has been the worst-performing sector in 2023, so the trend has been confirmed negative. Especially on a relative basis, energy has been a pretty tough place to be.
Here, we see how three growth sectors–Consumer Discretionary, Communication Services, and Technology–have absolutely dominated the US equity markets in 2023. Everything else has underperformed, with Energy coming in with a -21% relative return in the first five months of this year.
So what tells us this confirmed downtrend may be at an end?
Weekly Chart Shows Key Support
Let’s start with the weekly chart of the Oil Services ETF (OIH). Although the trend for these energy stocks in 2023 has been down, as evidenced by the daily chart below, the weekly chart actually shows a fairly consistent stepwise uptrend over the last two years.
Note the similarities between the recent of support at $250 with previous pullbacks in mid-2022 and late 2021. In all three cases, the price has pulled back and formed a double bottom. The weekly RSI has come down to around 40, but not much lower. This is classic behavior for a market in a primary uptrend experiencing short-term pullbacks.
And while this time certainly could be different, I’m inclined to assume that a price trend with certain characteristics will continue in its current form until proven otherwise.
Daily Chart Features Bullish Divergence
Now that we’ve established the long-term uptrend and how the recent pullback fits into that larger trend, let’s check the daily chart to see what the short-term picture has involved.
Now we see the multiple tests of resistance around $330 in the first quarter, followed by a significant drop in March. You may notice the dashed pink line which represents a 61.8% retracement of the September 2022 to January 2023 rally.
So that first big pullback of 2023 came right down to a Fibonacci support level. In May, we saw the OIH make frequent retests of support around $250, demonstrating that willing buyers have been willing to step in and buy OIH at that price point.
If you check the RSI in the panel below the price, you’ll see a clear bullish momentum divergence. This is where the price is making lower lows while the indicator is making higher lows. This tends to suggest a lessening of bearish momentum, and lack of downside pressure on price.
Now We Need Follow-Through
So it’s all bullish from here, right? Perhaps. But as they say, “the proof is in the price.”
Energy stocks ended this week in a position of short-term strength, handily outperforming growth sectors like Technology and Communication Services on Friday. Long-term gains always start as short-term gains, so now we need to confirm when a new uptrend is in place.
First, I’m watching the 50-day moving average. The OIH pushed above this key trend barometer this week, and I’d like to see if there is further upside momentum next week as well.
Second, I’d be looking for the RSI to push above 60. In bearish phases, the RSI tends to reach up to around 60 on upswings. In bullish periods, the RSI tends to become overbought. Can the RSI show that more willing buyers are entering the fray?
Finally, it’s all about relative strength. For energy stocks to be a compelling option for equity investors, the sector needs to start outperforming the benchmarks. Look for the relative strength to (finally!) turn higher.
We’ve spoken often of the dominance of a relatively small number of mega-cap growth stocks. How will we know when there is new leadership emerging for stocks? Just watch the price!
Interested in consuming this content in a convenient video format? Just head over to my YouTube channel!
RR#6,
Dave
P.S. Ready to upgrade your investment process? Check out my free behavioral investing course!
David Keller, CMT
Chief Market Strategist
StockCharts.com
Disclaimer: This blog is for educational purposes only and should not be construed as financial advice. The ideas and strategies should never be used without first assessing your own personal and financial situation, or without consulting a financial professional.
The author does not have a position in mentioned securities at the time of publication. Any opinions expressed herein are solely those of the author and do not in any way represent the views or opinions of any other person or entity.