


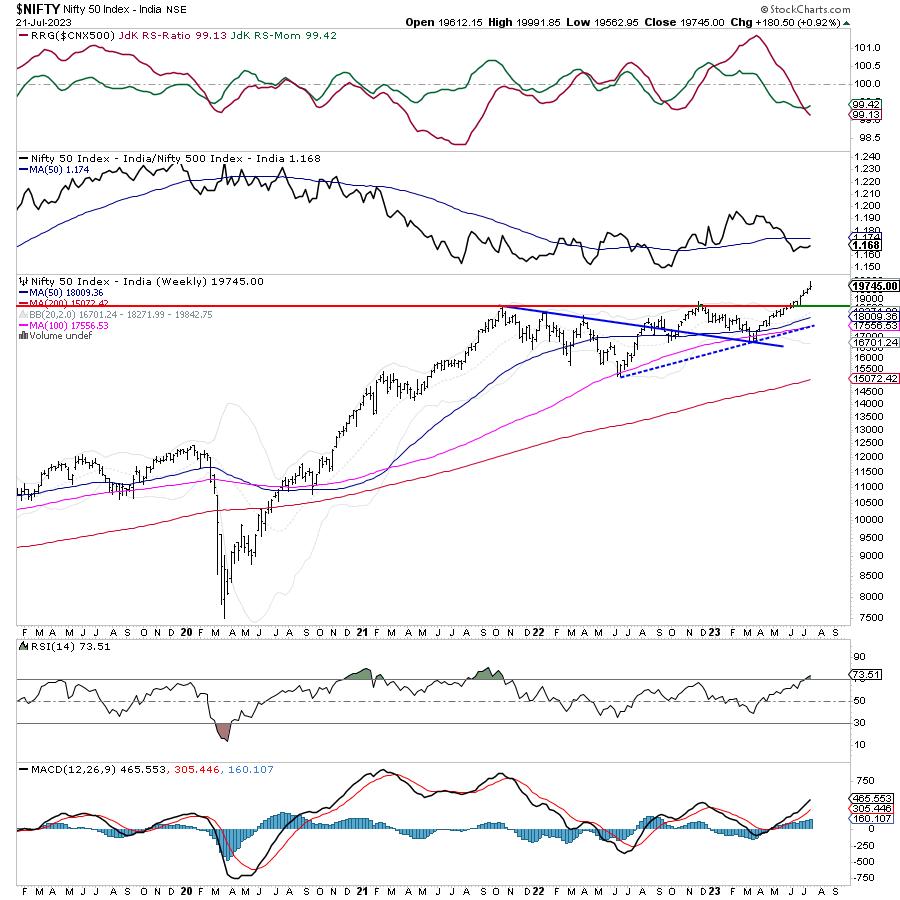
It is exactly a month when the NIFTY staged a major breakout by crossing above the previous high point of 18887; this time, it was the fourth week in a row when the markets extended their gains. This has also led to the markets closing at their fresh record lifetime highs as well. While some signs of mild consolidation appear on the shorter timeframe charts, the NIFTY stays in a firm uptrend post the breakout on the weekly charts. The trading range expanded; the NIFTY oscillated in a 428-point range over the past five days. The headline index finally closed with a net gain of 180.50 points (+0.92%) on a weekly basis.
The breakout that the NIFTY achieved a month ago is a major one; this is evidenced by the strong upward momentum that the markets have witnessed over the past four weeks. However, analysis of the shorter timeframe, i.e., daily charts, shows that the NIFTY might be in for some ranged consolidation. This translates into the week’s high point of 19991.85 acting as a temporary resistance and a top for the markets unless taken out convincingly. The volatility also increased; INDIAVIX edged higher by another 7.51% to 11.48. Despite this surge, VIX stays near one of its lowest levels seen over the past months.
The coming week also has a monthly derivatives expiry lined up; the days would remain influenced by rollover-centric activities. The week is likely to see a tepid start; the levels of 19850 and 20000 acting as potential resistance points. The supports come in at 17610 and 19470 levels.
The weekly RSI is 73.51; it has formed a new 14-period high. It stays neutral and does not show any divergence against the price. The weekly MACD is bullish and stays above the signal line.
A candle resembling a “Shooting Star” has emerged on the charts. This requires confirmation; this will be confirmed if a lower low is formed over the coming week. The current formation has the potential to stall the current rally and push the markets into some ranged consolidation.
The pattern analysis shows that the NIFTY staged a major breakout by crossing above 18887; this was a breakout from a large ascending triangle formed over the past ten months. The markets may take a breather; however, this breakout will stay intact and in force so long as NIFTY keeps its head above 18900 levels. So long as 18900 levels are protected, the markets are unlikely to show any major drawdowns from the current levels.
All in all, it is beyond an iota of doubt that the primary uptrend and the breakout that the markets achieved are still very much intact. However, there are some signs of a possibility of the markets taking a breather and consolidating within a defined and limited range. This requires that we adopt a highly stock-specific approach and navigate the markets on a highly selective note. While keeping new purchases highly stock-specific and selective, profits on the existing holdings should also be protected vigilantly at current and higher levels. A cautious approach is advised for the coming week.
Sector Analysis for the coming week
In our look at Relative Rotation Graphs®, we compared various sectors against CNX500 (NIFTY 500 Index), which represents over 95% of the free float market cap of all the stocks listed.
The analysis of Relative Rotation Graphs (RRG) shows that NIFTY Auto, Midcap 100, Consumption, and Realty Indices are inside the leading quadrant. Except for the Midcap 100 Index, the other groups are showing a decline in their relative momentum against the broader markets.
NIFTY PSE, Infrastructure, and NIFTY FMCG index are inside the weakening quadrant. Stock-specific performance may be seen from these groups.
Banknifty, Nifty Commodities, Financial Services, and Services Sector index are languishing inside the lagging quadrant and may relatively underperform the broader markets. The IT Index is also inside the lagging quadrant but it is seen continuing to improve its relative momentum against the broader markets.
The Pharma Index has rolled inside the improving quadrant; it may have begun its phase of improving relative performance against the broader markets. Nifty Energy, Media, and Metal Indices are also inside the improving quadrant.
Important Note: RRG™ charts show the relative strength and momentum of a group of stocks. In the above Chart, they show relative performance against NIFTY500 Index (Broader Markets) and should not be used directly as buy or sell signals.
Milan Vaishnav, CMT, MSTA
Consulting Technical Analyst