The S&P 500 SPDR bounced the last three weeks, but we did not see an improvement in breadth. Weak breadth is also reflected in performance for mid-caps and small-caps, which are lagging. Even so, SPY and QQQ are in short-term uptrends and I am watching the tech sector for clues.
Breadth is Not Keeping Pace with the Bounce – Plus MDY, IWM and XLK
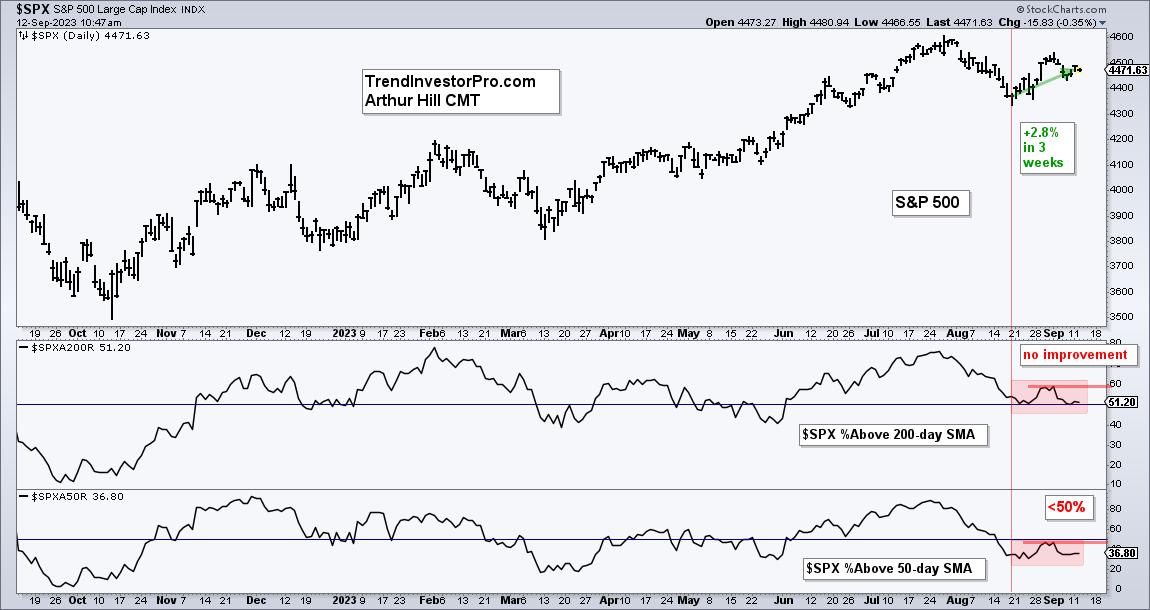
These charts were part of Tuesday morning’s Chart Trader report at TrendInvestorPro. The first chart shows the S&P 500 with the red vertical line marking August 18th. The index is up 2.8% since date. The first indicator window shows SPX %Above 200-day SMA moving sideways since this move (red shading). There was no improvement during the bounce. The second window shows SPX %Above 50-day SMA also moving sideways and remaining below 50%.
The next chart shows SPY, the S&P MidCap 400 SPDR (MDY) and the Russell 2000 ETF (IWM) since January 2023. SPY exceeded its February high and is currently around 7.5% above this high. MDY and IWM failed at the February high and are currently around 5% below this high. Small-caps and mid-caps are not the place to be.
Large-cap techs are the place to be. QQQ and XLK are leading the market and helping the large-cap weighted S&P 500 (SPY). The next chart shows XLK with a breakout in late August and short-term uptrend (blue dashed lines). At this point, traders must decide what it would take to prove this bullish stance wrong.
The dashed lines show a possible rising flag (bearish pattern). XLK is testing the flag line after a decline last week. There is also the big surge on August 29th (Marubozu candlestick). I am using the low of this candlestick to mark support at 169. A close below 169 would erase this big gain and clearly break flag support. Such a move would be bearish.
Check out the Chart Trader report at TrendInvestorPro for more details. Tuesday’s report updated levels for SPY and QQQ, highlighted TLT and covered yield spreads. We also provided some analysis and setups for ITB, SOXX, PPA and five stocks. Click here for immediate access.
Click here it learn about the TIP Indicator Edge Plugin for StockCharts ACP.
—————————————


