


Shares of British chip designer Arm (ARM) surged in price after its stock market debut on Thursday – closing up 25% from its IPO price. The gains put the company’s valuation at more than $64 billion, making it the biggest new offering in 2 years.
Arm’s strong performance is expected to have a positive impact on the IPO pipeline, where several companies are scheduled to go public in the coming weeks — including grocery delivery service Instacart, German footwear maker Birkenstock, and marketing automation platform Klaviyo. Should these IPOs also succeed, Wall Street is expecting a wave of stock market launches in 2024 as private companies that have been sitting on the sidelines turn public. After a lull lasting for about 18 months, the U.S. IPO market has already seen a pickup, with approximately 16 companies initiating the filing process in August.
All of this is great news for the Wall Street banks that help bring these companies to market, as the fees they generate can be substantial. Underwriting fees range an average of 4% to 7% of gross IPO proceeds, which can add up quickly. In fact, Arm is expected to pay as much as $104 million in fees, which will be split among several investment banks such as Goldman Sachs and J.P. Morgan. Both companies had top spots during 2021’s banner IPO year, and below are their charts, which are beginning to show signs of turning positive.
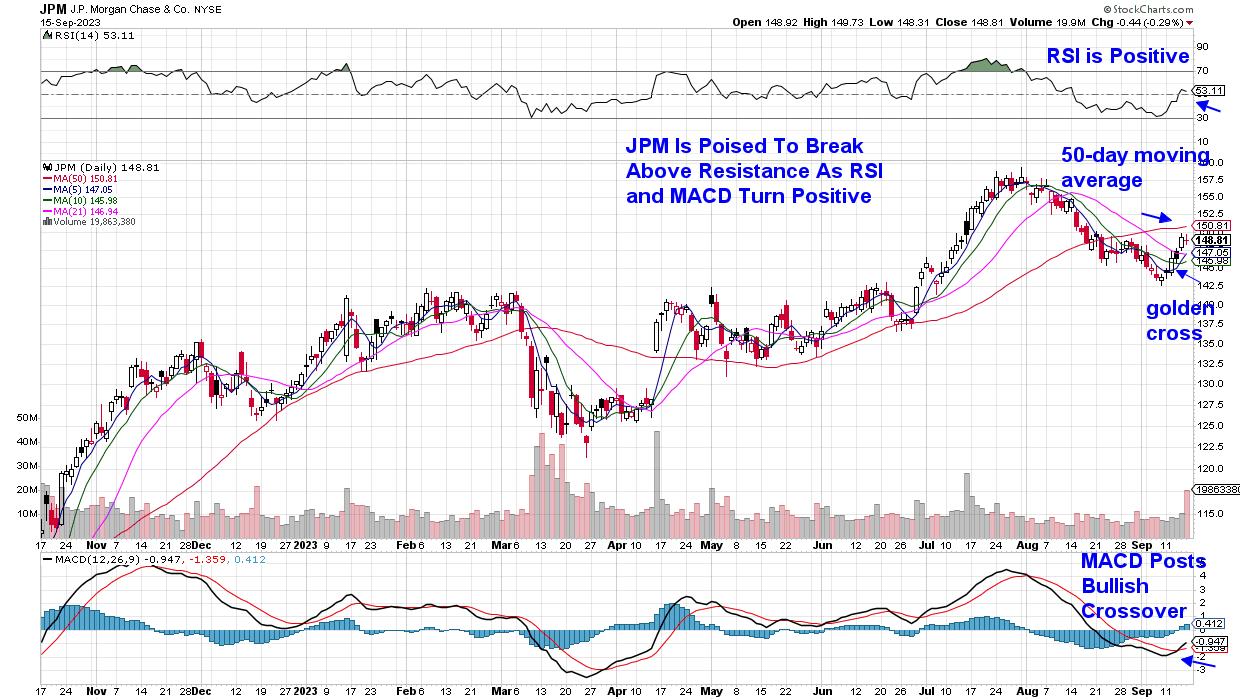
DAILY CHART OF J.P. MORGAN
J.P. Morgan (JPM) closed above its 10- and 21-day moving averages last week on relatively high volume, which, in turn, pushed the RSI into positive territory. The MACD has posted a bullish crossover, with the black line crossing above the red. The next big hurdle will be a close above its 50-day moving average, which would confirm a new uptrend.
DAILY CHART OF GOLDMAN SACHS (GS)
Goldman Sachs (GS) is a bit more advanced in its efforts to turn bullish. The stock closed above its key 50- and 200-day moving averages following a rally that pushed the MACD into positive territory, where it joined the already positive RSI. Last week’s gain has put the stock’s price well above its moving averages, so that it may enter a period of consolidation while these moving averages catch up.
While most investors in the U.S. likely haven’t heard of Arm, most use the company’s products every day, as the company designs and creates chips used in smartphones, laptops, and video games. The company is expected to play a big role in AI adoption, which is said to have driven most of Thursday’s buying. Outside of Arm’s rally, however, price action among Semiconductor stocks was quite negative last week, with the group slumping further below its key moving averages and posting a negative RSI and MACD (using ETF SOXX).
Longer-term, though, the outlook remains positive for key Semiconductor chip providers, and if you’d like to be alerted to when these names enter new uptrends and are in strong buy zones, use this link here to trial my twice weekly MEM Edge Report for a nominal fee. This report specializes on keeping subscribers on top of critical turns in the market, and those stocks that are in a position to benefit the most.
Warmly,
Mary Ellen McGonagle, MEM Investment Research