


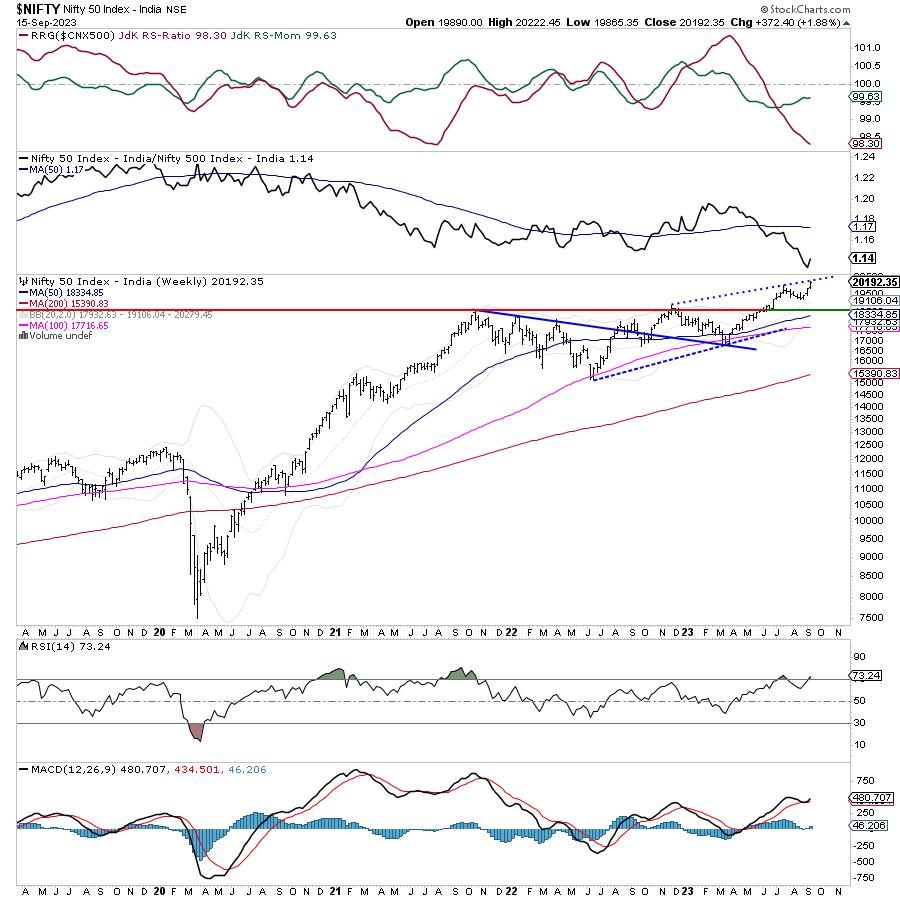
While extending their move, Indian equities advanced higher and closed with yet another weekly gain. Four out of five days over the past week saw the markets ending with gains. In the previous technical note, it was mentioned that the undercurrents in the market remain strong and NIFTY can retest the previous high levels. While trading on these expected lines, the headline index went on to post an incremental lifetime high as well. The trading range remained modest; the NIFTY moved in a 357-point over the past week. This month has been quite strong for the markets; the index has gained 938.55 points or 4.87% in this month; however, on a weekly basis, the benchmark index has closed posting a net gain of 372.40 points (+1.88%).
The coming few days can be a bit tricky to navigate as the markets are prone to some consolidation or minor corrective retracement from current levels. Importantly, the coming week is a truncated one with Tuesday, September 19, a trading holiday on account of Ganesh Chaturthi. Volatility increased slightly as INDIAVIX rose by 1.14% to 10.90 weekly; however, this now once again leaves us at one of the lowest levels and once again exposes the markets to probable vulnerability and profit-taking bouts. This is something one needs to keep a keen eye on; besides this, the derivatives data suggests strong Call OI built up at the 20200-20300 zone and this creates a resistance area for the NIFTY over the immediate near term.
The coming week is likely to see a bit jittery start; the levels of 20250 and 20390 are expected to act as resistance levels. The supports come in at 20000 and 19820 levels.
The weekly RSI is 73.24 and is mildly overbought. However, it also shows a mild bearish divergence against the price as it has not posted a new high along with the price. The weekly MACD is bullish and stays above its signal line.
The pattern analysis of the weekly charts shows that after achieving a breakout by moving past 18900 levels, the index went on to form its high point at 20990 levels. After this, it gave up close to 75% of this move but resumed its uptrend to surpass the previous high. However, it also appears that the index may resist an intermediate trend line drawn from 18900 levels which subsequently joins the next high point at 20990.
All in all, just like the previous week, the markets continue to remain highly stock-specific; we are unlikely to see any sector dominance but instead may see select stocks from multiple sectors doing well. Besides this, we may see some defensive outlook playing out as well. The low VIX remains a concern once again and therefore, it would be prudent to avoid over-leveraged exposures. While the financial space is looking at playing catchup, traditionally defensive pockets like IT, Pharma, FMCG/Consumption, etc. may attempt to relatively outperform the broader markets.
Sector Analysis for the coming week
In our look at Relative Rotation Graphs®, we compared various sectors against CNX500 (NIFTY 500 Index), which represents over 95% of the free float market cap of all the stocks listed.
Relative Rotation Graphs (RRG) show that Nifty Energy, Midcap 100, Media, Metal, PSU Bank, and Pharma indices are inside the leading quadrant. While these groups may continue to relatively outperform the broader markets, they are also seen modestly giving up on their relative momentum. This may lead to both, relative outperformance and also some slowing down of momentum from these sectors.
The Nifty Realty and Auto Indices are inside the weakening quadrant. Individual stock-specific performance from these groups cannot be ruled out.
The Nifty FMCG, Consumption, Financial Services, Banknifty, and Services sector indices are inside the lagging quadrant. Again, stock-specific performance can be expected from these groups but relative performance may take some time to show.
The NIFTY IT and Commodities indices stay inside the improving quadrant; they may continue to better their relative performance against the broader markets.
Important Note: RRG™ charts show the relative strength and momentum of a group of stocks. In the above Chart, they show relative performance against NIFTY500 Index (Broader Markets) and should not be used directly as buy or sell signals.
Milan Vaishnav, CMT, MSTA
Consulting Technical Analyst