


We are so excited that StockCharts.com is now offering you our ACP plugins, we had to write about it for today’s Daily, especially since you can read anywhere the thousands of differing opinions on what Powell said today and the implications for the market. Simply put, these indicators are the crux of our trading decisions.
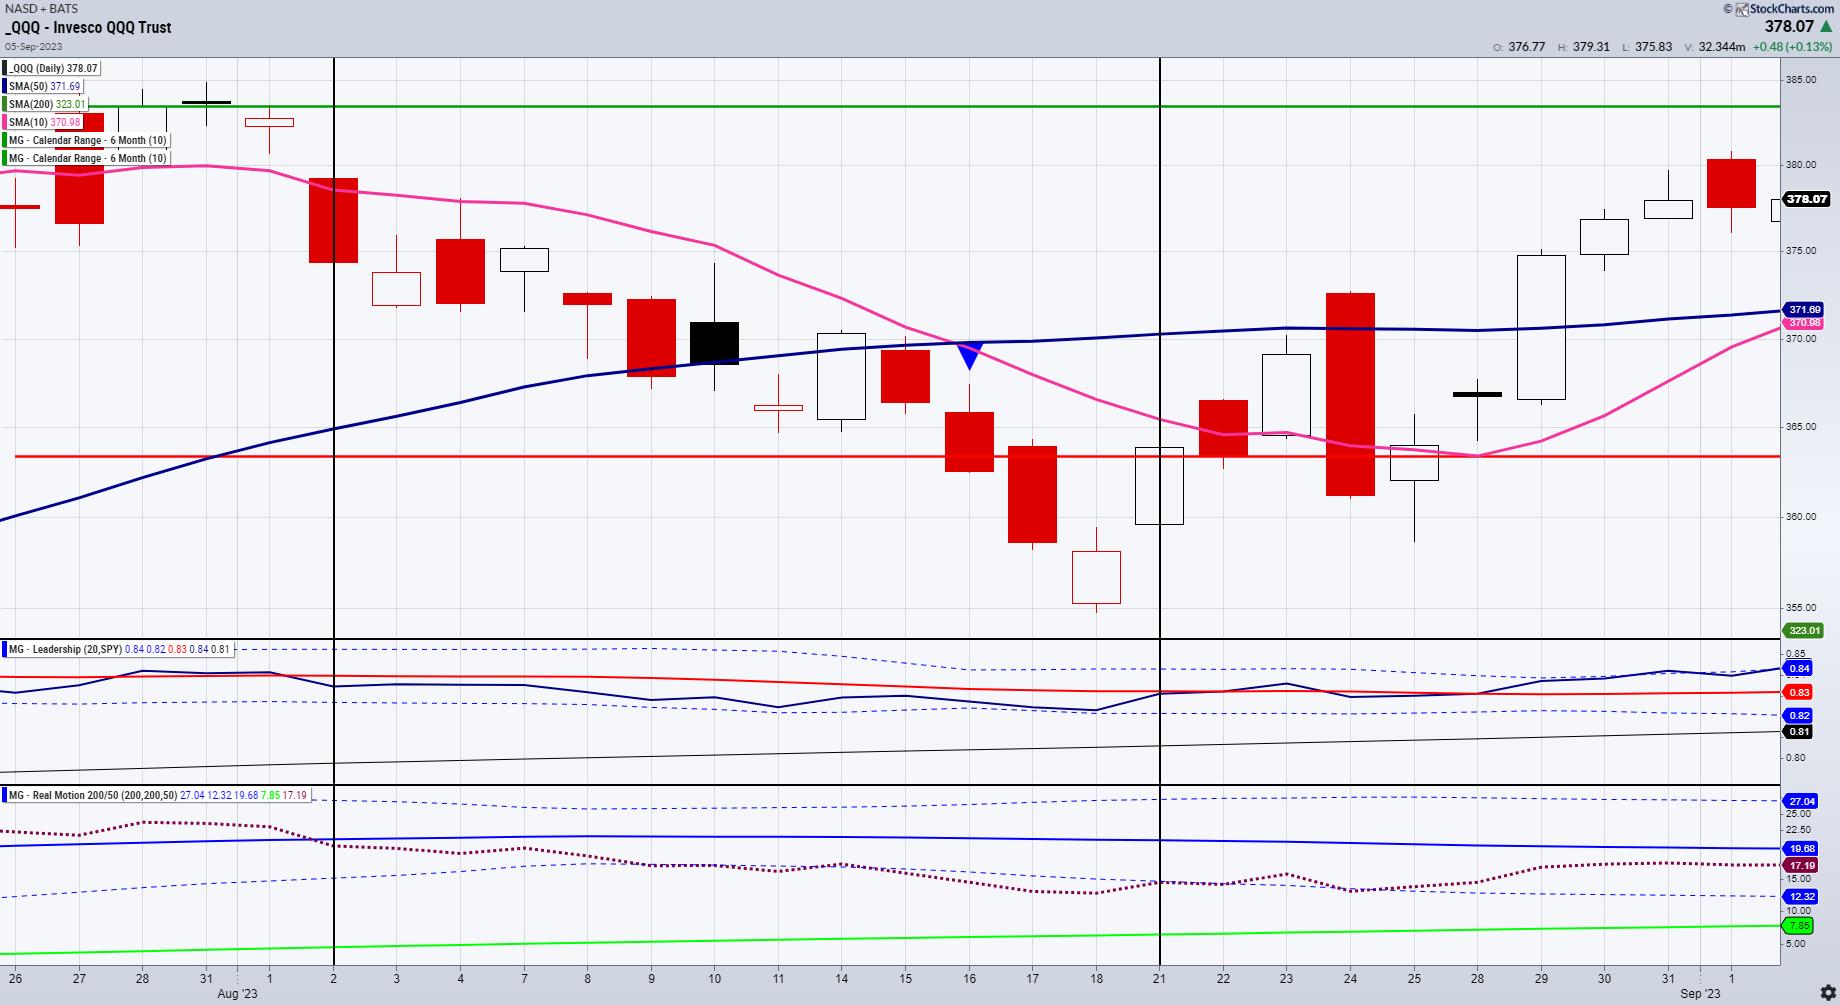
Note the vertical line drawn on the chart for August 2, 2023. This is just one example of how the 3 indicators told you exactly what was happening in NASDAQ 100, or the QQQs.
The newest ACP plugin is the 6-month calendar range. We also have the one-month calendar range available. For today, though, we are focusing on 6-months.
The Daily has covered the July 6-month calendar range reset A LOT since mid-July. Why? Because in January, how the varying instruments traded up down or around the 6-month trade told us who would lead and who would lag. It worked extraordinarily well.
In this QQQs chart, on July 31st, QQQs made a run for the green horizontal line (July 6-month high) and failed to stay above it the next day. On August 2nd, QQQs gapped down, thereby failing to clear the key 6-month range high. If we follow the vertical line down, the next thing you see is the Leadership indicator, or how an instrument performs against the benchmark.
On August 2nd, QQQs began to underperform the SPY. This, alongside the failure of the calendar range, was a heads-up that a selloff was coming.
The chart on the bottom is the Real Motion or Momentum chart. On August 2nd, momentum broke down under the 50-DMA (blue line) while prices were above their 50-DMA. This told us we were having a bearish divergence in momentum versus price.
Had you sold either your longs or gone short at around 375, by August 18th, the QQQs traded down to 354.71, breaking the July 6-month calendar range low (red horizontal line).
Note the second black vertical line.
On August 21st, the price cleared back over the calendar range low and Real Motion flashed a mean reversion (crossing back above the dotted Bollinger Band lines). Plus, QQQs began to outperform the SPY once again.
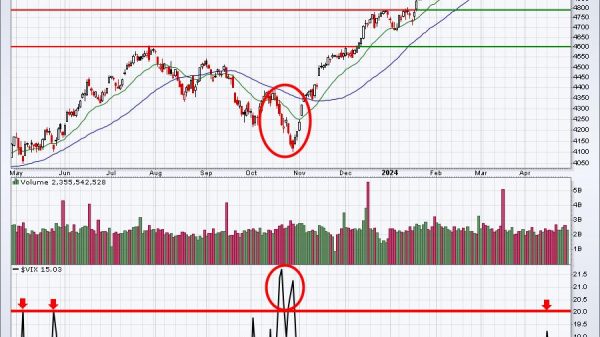
Of course, nothing is perfect. However, many of you have heard me either talk or write about these 3 indicators repeatedly because they have served as a backbone for my market timing. Currently, QQQs are heading back towards the July 6-month calendar range low and into support. QQQs are once again underperforming SPY.
As for momentum, that is waning with price after the FED announcement “higher for longer.”
A cautious, but not necessarily a full-blown bearish, approach to the market is what our plug-ins are telling us. You can find these indicators at our site MarketGauge.com or on StockCharts.com.
This is for educational purposes only. Trading comes with risk.
For more detailed trading information about our blended models, tools and trader education courses, contact Rob Quinn, our Chief Strategy Consultant, to learn more.
If you find it difficult to execute the MarketGauge strategies or would like to explore how we can do it for you, please email Ben Scheibe at Benny@MGAMLLC.com.
“I grew my money tree and so can you!” – Mish Schneider
Get your copy of Plant Your Money Tree: A Guide to Growing Your Wealth and a special bonus here.
Follow Mish on Twitter @marketminute for stock picks and more. Follow Mish on Instagram (mishschneider) for daily morning videos. To see updated media clips, click here.
Mish in the Media
Take a look at this analysis of StockCharts.com’s Charting Forward from Jayanthi Gopalkrishnan, which breaks down Mish’s conversation with three other charting experts about the state of the market in Q3 and beyond.
Mish was interviewed by Kitco News for the article “Oil Prices Hit Nearly One-Year High as it Marches Towards $100”, available to read here.
Mish covers short term trading in DAX, OIL, NASDAQ, GOLD, and GAS in this second part of her appearance on CMC Markets.
Mish talks Coinbase in this video from Business First AM!
Mish Looks at some sectors from the economic family, oil, and risk in this appearance on Yahoo Finance!
Mish Covers oil, gold, gas and the dollar in this CMC Markets video.
In this appearance on Business First AM, Mish explains why she’s recommending TEVA, an Israeli pharmaceutical company outperforming the market-action plan.
As the stock market tries to shake off a slow summer, Mish joins Investing with IBD to explain how she avoids analysis paralysis using the six market phases and the economic modern family. This edition of the podcast takes a look at the warnings, the pockets of strength, and how to see the bigger picture.
Mish was the special guest in this edition of Traders Edge, hosted by Jim Iuorio and Bobby Iaccino!
In this Q3 edition of StockCharts TV’s Charting Forward 2023, Mish joins a panel run by David Keller and featuring Julius de Kempenaer (RRG Research & StockCharts.com) and Tom Bowley (EarningsBeats). In this unstructured conversation, the group shares notes and charts to highlight what they see as important considerations in today’s market environment.
Mish discusses AAPL in the wake of the iPhone 15 announcement on Business First AM.
Mish explains how to follow the numbers in oil, gas, gold, indices, and the dollar daytrading the CPI in this video from CMC Markets.
Mish talks commodities, and how growth could fall while raw materials could run after CPI, in this appearance on BNN Bloomberg.
In this appearance on Fox Business’ Making Money with Charles Payne, Mish and Charles discuss the normalization of rates and the benefit, plus stocks/ETFs to buy.
Mish chats about sugar, geopolitics, social unrest and inflation in this video from CNBC Asia.
Mish talks inflation that could lead to recession on Singapore Breakfast Radio.
Coming Up:
September 20: Mario Nawfal Spaces, 8am ET
September 21: Your Daily Five, StockCharts TV
September 22: Benzinga Prep Show
October 29-31: The Money Show
ETF Summary
S&P 500 (SPY): 440 now pivotal.Russell 2000 (IWM): 180 support.Dow (DIA): 347 pivotal, 340 support.Nasdaq (QQQ): 363 support.Regional Banks (KRE): 42 support.Semiconductors (SMH): 143.35, the 8/18 low, now must hold.Transportation (IYT): 235 support.Biotechnology (IBB): Compression between 124-130.Retail (XRT): Weak, especially if this breaks down under 57, the 80-month moving average.
Mish Schneider
MarketGauge.com
Director of Trading Research and Education