


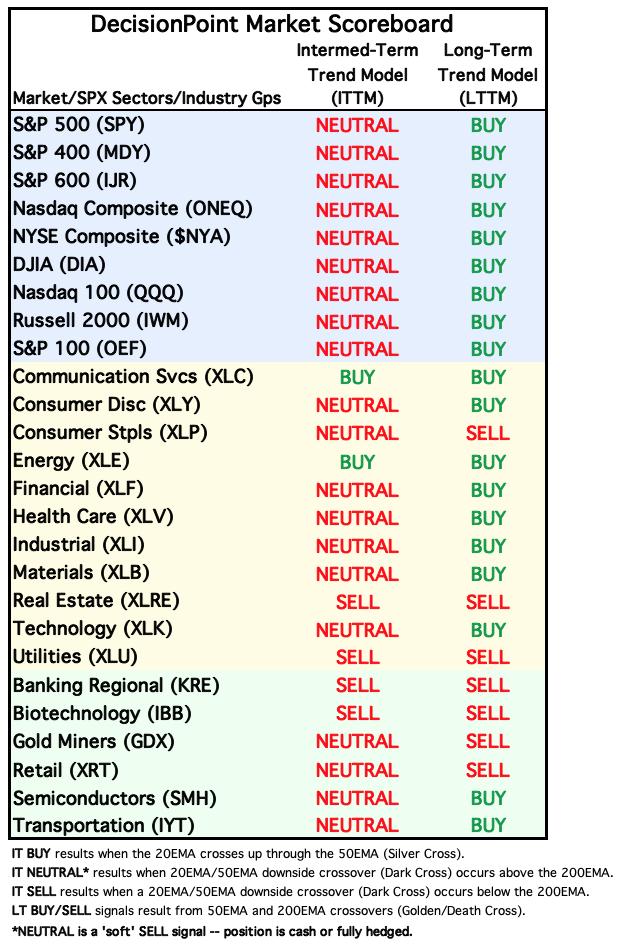
We have introduced two new tables in the DecisionPoint ALERT to give an overview of trend and BIAS for the major market indexes, sectors, and industry groups that we track. The first is our Market Scoreboard, which shows the current Intermediate-Term and Long-Term Trend Model (ITTM and LTTM) signal status. To review:
The IT Trend Model generates a BUY Signal when the 20-day EMA crosses up through the 50-day EMA (Silver Cross). The IT Trend Model generates a NEUTRAL Signal when the 20-day EMA crosses down through the 50-day EMA (Dark Cross) above the 200-day EMA. This is a soft SELL Signal, going to cash or a hedge. This avoids being short in a bull market.The IT Trend Model generates a SELL Signal when the 20-day EMA crosses down through the 50-day EMA (Dark Cross) below the 200-day EMA.
The LT Trend Model generates a BUY Signal when the 50-day EMA crosses up through the 200-day EMA (Golden Cross).The LT Trend Model generates a SELL Signal when the 50-day EMA crosses down through the 200-day EMA (Death Cross).
The current table shows that there is considerable stress in the intermediate-term; however, the long-term is still comfortably green for market and sector indexes. But we need to remember that the market indexes are cap-weighted, which means that they can be held aloft by large-cap stocks. The 11 sectors shown are composed solely of S&P 500 components, meaning that they will reflect the strength of that index. Industry groups, however, are not doing as well because they are less protected by the large-cap umbrella.
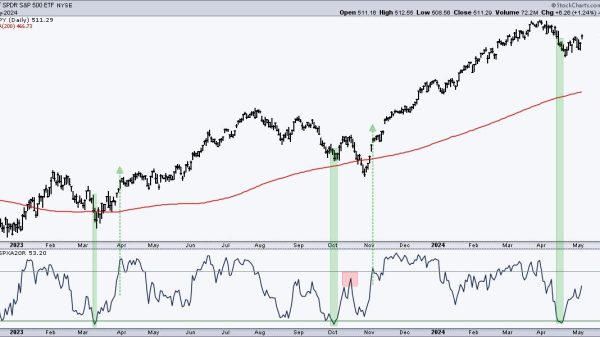
Next, let’s look at how we determine the BIAS of a given index. First, the Silver Cross Index shows the percentage of stocks in an index that have a Silver Cross (20-day EMA above the 50-day EMA), and the Golden Cross Index shows the percentage of stocks in the index that have a Golden Cross (50-day EMA above the 200-day EMA). Next we determine BIAS based upon the relationship of the Silver Cross Index to its 10-day EMA, and the relationship of the Golden Cross Index to its 20-day EMA. When they are above, the BIAS is bullish. When they are below, the BIAS is bearish. See the chart below.
The following table shows the current intermediate-term and long-term BIAS of the market, sector, and industry group indexes we follow. Note that the picture is extremely bearish, but it is a very oversold condition, which will shift toward the positive in the event of a strong rally.
Conclusion: These new tables, available daily in the DecisionPoint ALERT, provide a quick overview of market trend and BIAS. They are intended to help focus attention on areas that may be of interest. They do not give action commands, but provide information flags to prompt assessment of the relevant charts.
Learn more about DecisionPoint.com:
Watch the latest episode of DecisionPoint on StockCharts TV’s YouTube channel here!
Try us out for two weeks with a trial subscription!
Use coupon code: DPTRIAL2 at checkout!
Technical Analysis is a windsock, not a crystal ball. –Carl Swenlin
(c) Copyright 2023 DecisionPoint.com
Disclaimer: This blog is for educational purposes only and should not be construed as financial advice. The ideas and strategies should never be used without first assessing your own personal and financial situation, or without consulting a financial professional. Any opinions expressed herein are solely those of the author, and do not in any way represent the views or opinions of any other person or entity.
DecisionPoint is not a registered investment advisor. Investment and trading decisions are solely your responsibility. DecisionPoint newsletters, blogs or website materials should NOT be interpreted as a recommendation or solicitation to buy or sell any security or to take any specific action.
Helpful DecisionPoint Links:
DecisionPoint Alert Chart List
DecisionPoint Golden Cross/Silver Cross Index Chart List
DecisionPoint Sector Chart List
Price Momentum Oscillator (PMO)