


As Q3 and a dismal September end, some interesting dynamics are playing out in the stock market.
You can blame higher interest rates for some of the disjuncture that’s going on. The CBOE Volatility Index ($VIX) is relatively low, yet the percentage of stocks trading below their 50-, 100-, and 200-day moving averages is relatively low. Here’s the market in a nutshell:
The Dow Jones Industrial Average ($INDU) is trading below its 200-day moving average. The S&P 500 ($SPX) is trading below its 100-day moving average.The Nasdaq Composite ($COMPQ) is trading below its 100-day moving average. The CBOE Volatility Index ($VIX) is relatively low, at less than 18.Year to date, Communication Services, Technology, and Consumer Discretionary are the three leading sectors.
We saw a similar scenario unfold in 2005, but there are stark differences between then and now. In 2005, Energy was the leading sector for the year, with Utilities in second place. Communication Services and Consumer Discretionary were the two sectors in negative territory.
The Big Picture
Although history is known to repeat itself, each time, it’s still somewhat different. This year, investors are uncertain about inflation and interest rates. Plus, there is the possibility of a US government shutdown that could weave its way into the stock market. As Q3 ends and we gear up for Q4, it’s important to have the bigger picture in mind.
Let’s start with market breadth.
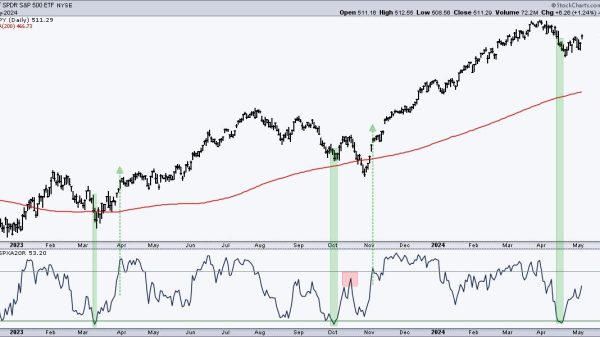
The chart below gives a good picture of the overall market breadth. The NYSE new 52-week highs ($NYHGH) are slowly rising. The new 52-week lows spiked, but they’re slowing down. And if you look at the high/low ratio, it’s pretty flat.
CHART 1: S&P 500 AND MARKET BREADTH. If there was one word to sum up the performance of the stock market, it would be “meh!” There’s not much momentum in either direction.Chart source: StockCharts.com. For educational purposes.
The market seems to be lacking momentum. Sometimes, it looks like it will move up, but sellers come in and cap the move. Similarly, when the market looks like it’s going to sink, buyers prop it up. So what catalyst will move the market in either direction? Will it be earnings, or something else?
The general thinking among Wall Street analysts is that Q4 will see strong earnings, which could be the catalyst the market is waiting for. But, on the flip side, Treasury yields are high. And higher yields haven’t been great for growth stocks.
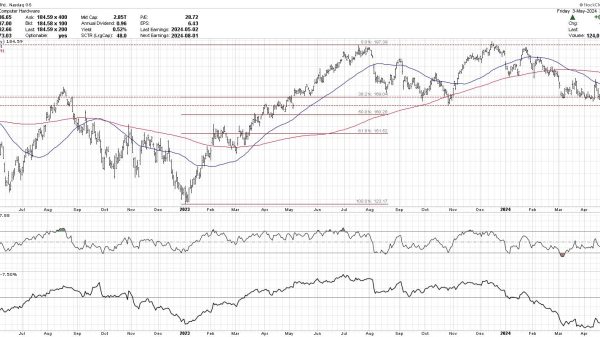
The chart below shows the relationship between the S&P 500 and the 10-year Treasury Yield Index ($TNX). In the last half of September, the two diverged significantly.
CHART 2: S&P 500 VS. 10-YEAR TREASURY YIELDS. Rising yields generally hurt growth stocks, as is evidenced in this chart. As yields were rising, the S&P 500 was moving lower.Chart source: StockCharts.com. For educational purposes.
Yields have reached levels they haven’t seen since 2007, and let’s hope the market doesn’t perform the way it did in 2007. The circumstances are indeed different this time. We don’t have the high levels of mortgage debt like we did then. There’s a chance that interest rates may be close to a peak, although the Fed could still hike once more this year. So, that may mean yields could stay higher for longer. And it’s the “higher for longer” regime that could be causing hesitancy among investors.
The bigger question is if stocks can perform well while interest rates are high. The dominant seasonality narrative of Q4 being strong could unfold. But if the large mega-cap stocks lead in Q4, could higher interest rates act as headwinds? If they are, it could make for relatively muted growth in Q4. But there’s a chance that other asset classes could dominate. How will the last three months of 2023 shape up?
The Bottom Line
It all depends on what interest rates do. The market could go either way. It could turn around and go higher, or could fall even further before moving higher. Keep an eye on market breadth, because it can reveal what’s brewing underneath the price bars.
End-of-Week Wrap-Up
US equity indexes mixed; volatility up
$SPX down 0.27% at 4288.05, $INDU down 0.47% at 33507.50; $COMPQ up 0.14% at 13219.32$VIX up 1.04% at 17.52Best performing sector for the week: EnergyWorst performing sector for the week: UtilitiesTop 5 Large Cap SCTR stocks: Super Micro Computer (SMCI); Dell Technologies (DELL); Palantir Technologies (PLTR); Splunk Inc. (SPLK); Jabil, Inc. (JBIL).
On the Radar Next Week
September ISM Manufacturing PMIFed speechesISM Services PMISeptember non-farm payrolls
Disclaimer: This blog is for educational purposes only and should not be construed as financial advice. The ideas and strategies should never be used without first assessing your own personal and financial situation, or without consulting a financial professional.