


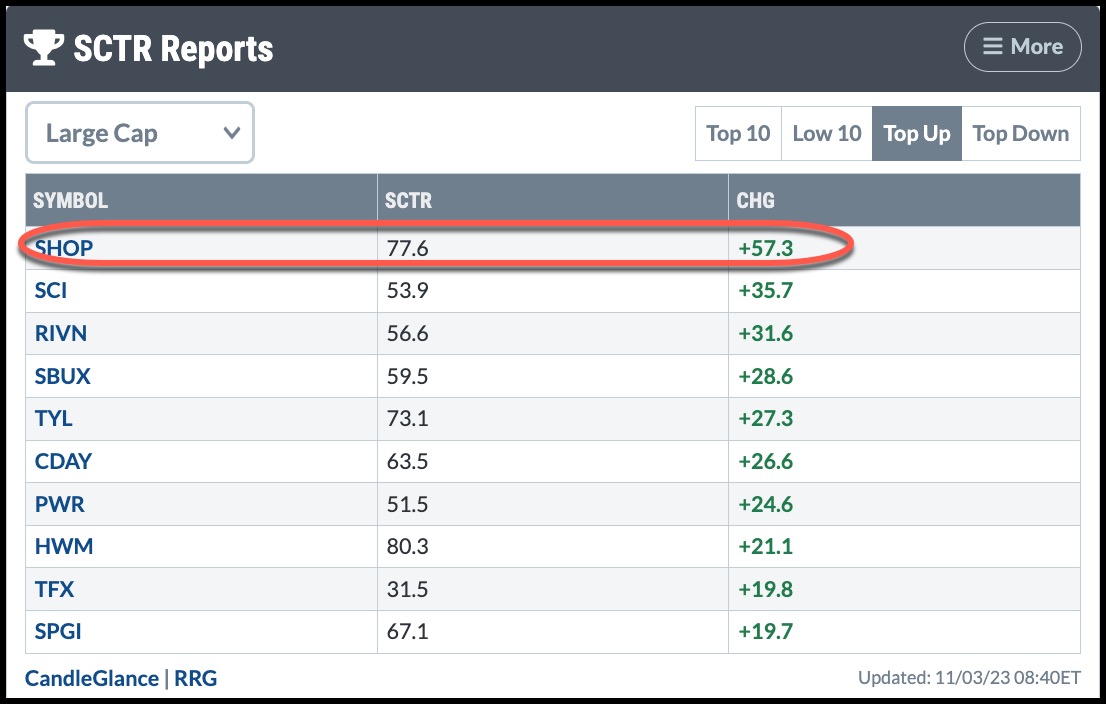
Shopify (SHOP) share value jumped by over 20% Thursday morning after stunning analysts with a sharp earnings beat and rosy guidance. The stock reached the top of the StockCharts Technical Rank report in the Large Cap, Top Up category.
CHART 1: SHOPIFY STOCK SAW THE LARGEST SCTR RISE ON NOVEMBER 3, 2023. Chart source: StockCharts.com. For educational purposes.
Despite a 35% fall from its 2023 high of $71.43, its comeback suggests that the e-commerce industry is still kicking.
Can SHOP sustain this upward momentum? Where might an effective entry point be, and what headwinds lie above the current price? Let’s take a closer look, starting with the monthly chart.
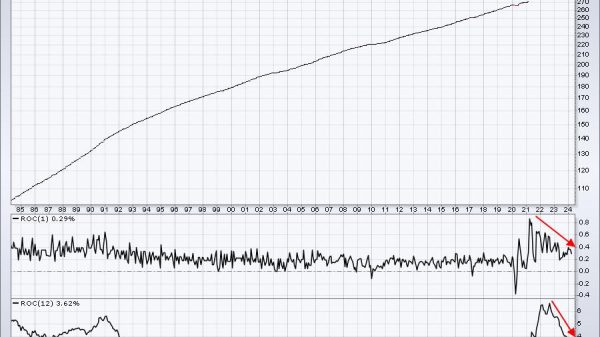
CHART 2. MONTHLY CHART OF SHOP. As the stock attempts to reverse, note how the dwindling volume coincides with a drying-up of selling activity. Chart source: StockCharts.com. For educational purposes.
Looking back on a monthly scale, you can see SHOP’s plunge. The end of 2022 saw SHOP’s bearish capitulation leading to a rally and a near-term drop. While volume receded significantly since the middle of 2022, so too did the selling pressure, as shown by the Chaikin Money Flow (CMF).
On the weekly chart below, you can see that SHOP formed a Head and Shoulders Bottom pattern from the middle to the end of last year.
CHART 3. WEEKLY CHART OF SHOP. The head & shoulders bottom pattern that formed toward the end of last year painted a bullish picture of SHOP’s recovery. Chart source: StockCharts.com. For educational purposes.
Many traders use the head & shoulders pattern daily to make tactical decisions. On a weekly scale, the pattern indicates longer-term trend shifts, often reflecting broader fundamental factors. And in this case, the indication is bullish. Note that SHOP prices have been hovering resiliently over the neckline level of $45 since January 2023.
CHART 4. DAILY CHART OF SHOP. Planning your trade around support and resistance is critical. Plus, be aware that breakaway gaps often don’t get filled. Chart source: StockCharts.com. For educational purposes.
SHOP’s surge came in the form of a breakaway gap—in this case, a gap up from a near-term downtrend. Breakaway gaps have a low fill rate. And while this would tempt some traders to go long now, it helps to see the bigger context. The relative strength index (RSI) is rising, and though it’s approaching the 70 level, it might also just reflect the magnitude of today’s post-earnings jump.
Eventually, SHOP may come across historical resistance levels at $67 and $71.50. Until then, there’s strong support at $50.50 and, below that, $45.50.
The Bottom Line
If you were bullish on SHOP leading up to Thursday’s earnings, you might have entered a position immediately upon market open. Again, breakaway gaps don’t often get filled, especially in the week of the gap, but there’s never any guarantee.
Keep your eye on Shopify stock as investors assess whether there’s enough fundamental fuel to justify the technical break. Whether you’re already long the stock or planning to enter a position soon, set an alert at support and/or resistance depending on your strategy.
Disclaimer: This blog is for educational purposes only and should not be construed as financial advice. The ideas and strategies should never be used without first assessing your own personal and financial situation, or without consulting a financial professional.