


Two weeks of decline, one week of advance, and a week of consolidation. This is what sums up the market activity over the past month. The markets consolidated over the past week and stayed largely within a defined trading range. The previous five sessions have remained choppy with the Nifty managing to cling to the short-term 20-day MA; while on the weekly charts, it continues to stay prone to consolidation. The trading range got narrower as the index oscillated in a 423-point range during the week. The headline index finally closed with a negligible weekly loss of 71.30 points (-0.33%).
From a technical perspective, the markets are demonstrating a higher possibility of some consolidation or a limited corrective retracement. The zone of 22100-22200 is a major resistance zone as evidenced through pattern analysis as well as OI data. Also, the wider-than-usual bands are also likely to keep the markets in a broad trading range. A runaway upmove is likely only if the Nifty crosses the 22100-22200 zone convincingly; until this happens, we will see the markets staying prone and vulnerable to profit-taking bouts at higher levels. Volatility continued surging higher; India VIX rose by 5.10% to 15.45 on a weekly note.
The markets are likely to see a quiet start to the week; the levels of 21900 and 22080 are likely to act as resistance points. The supports are likely to come in at 21600 and 21480 levels.
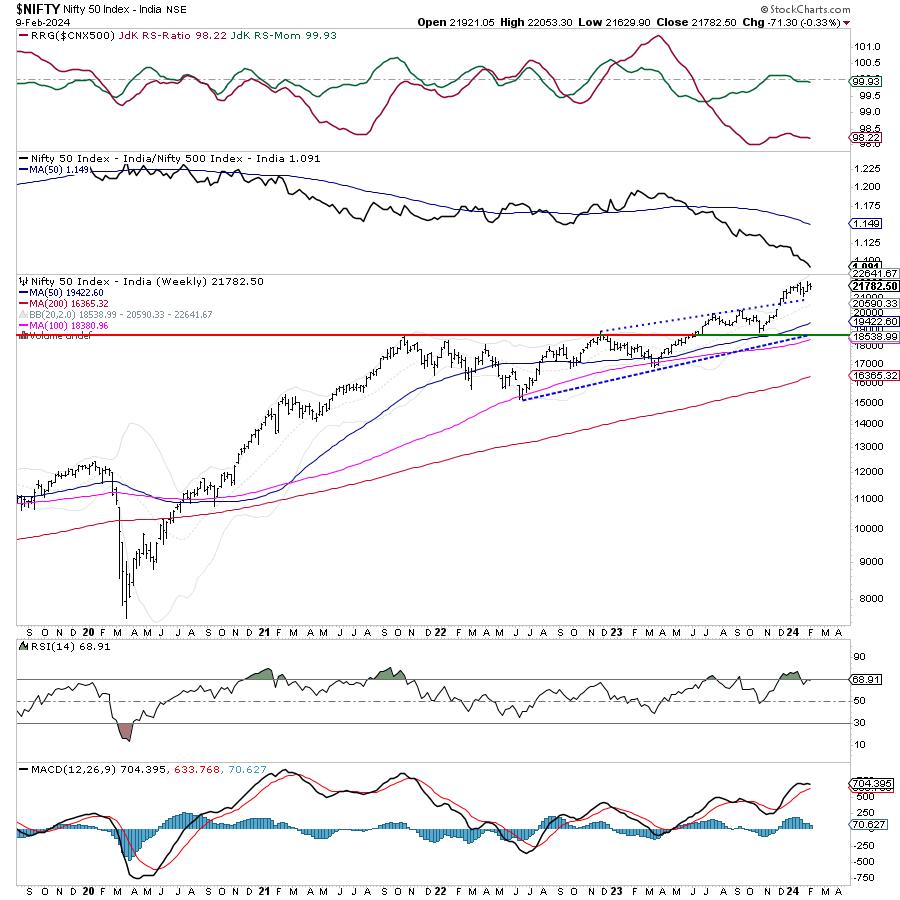
The weekly RSI is 68.91; it stays neutral and does not show any divergence against the price. The weekly MACD is bullish and stays above the signal line. The narrowing Histogram hints at a deceleration of momentum is also observed as well.
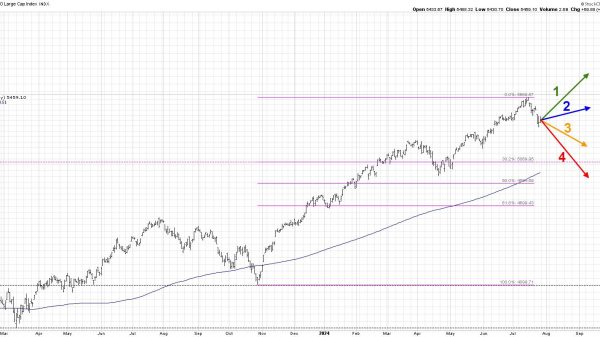
The pattern analysis on the weekly charts shows that the Nifty saw a breakout once it crossed above 20800 levels. This breakout from the rising channel saw the Index testing its recent highs above 22000 levels. Presently, the Index is seen consolidating and some minor retracements cannot be ruled out. A sustainable upmove shall take place only after the Nifty manages to cross above the 22100-22200 zone.
The coming week continues to hint at a possible consolidation or a minor retracement in Nifty. However, we can see Nifty Bank, one of the key sector indices, bettering its relative strength. Along with Nifty Bank, we can expect resilient performance from defensive pockets like IT, Pharma, FMCG, etc. It is strongly advised to avoid large leveraged positions. While adopting a highly selective approach, vigilant protection of profits is also advised at higher levels.
Sector Analysis for the coming week
In our look at Relative Rotation Graphs®, we compared various sectors against CNX500 (NIFTY 500 Index), which represents over 95% of the free float market cap of all the stocks listed.
Relative Rotation Graphs (RRG) show that Nifty PSE, Realty, PSU Bank, Infrastructure, Metal, IT, Commodities, and Energy indices are inside the leading quadrant of the RRG. While the Realty Index is seen giving up on its relative momentum, all the other groups are set to relatively outperform the broader markets.
The Nifty Auto and Midcap 100 Index remains in the weakening quadrant. Individual performance from these sectors may not be ruled out but they may continue to slow down on their relative performance.
The Nifty Financial Service, FMCG, Consumption, Nifty Bank, and Media Indices continue to languish inside the lagging quadrant. While the Media Index stays deep inside the lagging quadrant, the Pharma Index is showing sharp improvement in its relative momentum despite being inside the lagging quadrant. Except for the Pharma Index, the other groups may relatively underperform the broader index.
The Nifty Services Sector index is the only one inside the improving quadrant; however, it also appears to be on the verge of rolling inside the lagging quadrant.
Important Note: RRG™ charts show the relative strength and momentum of a group of stocks. In the above Chart, they show relative performance against NIFTY500 Index (Broader Markets) and should not be used directly as buy or sell signals.
Milan Vaishnav, CMT, MSTA
Consulting Technical Analyst