


In the truncated week, the markets largely wore a corrective look as the key indices lost ground during the week. In the previous technical note, it was mentioned that on the one hand, no runaway moves should be expected, and on the other hand the support for Nifty exists much below at 20-week MA. The markets ended up trading precisely on the expected lines. Not only they did not move higher but also ended up testing the mentioned support level. The trading range got wider as the Nifty oscillated in a 649.80-point range during the truncated week. The volatility spiked; India Vix surged by 16.69% to 13.46. The headline index Nifty closed the week with a net weekly loss of 372.40 points (-1.65%).
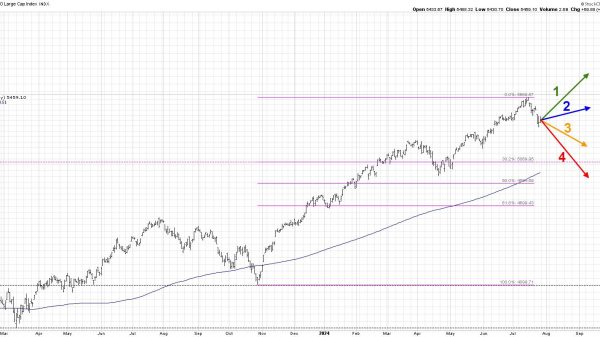
From a technical perspective, the markets have dragged their resistance points lower. While the high point of 22775 has become an intermediate top for the Nifty, the immediate resistance has been dragged lower to 22427 which is the high of the previous week. On the other hand, the 20-week MA which is placed at 21921 can be considered immediate support on a closing basis. The 100-DMA also falls in the close vicinity; it currently stands at 21729. Over the coming days, we can largely expect the Nifty to remain in a broad trading range with 22450-22500 working as strong resistance points.
The coming week will likely see a stable start with the levels of 22450 and 22700 acting as potential resistance points. The supports come in at 22000 and 21780.
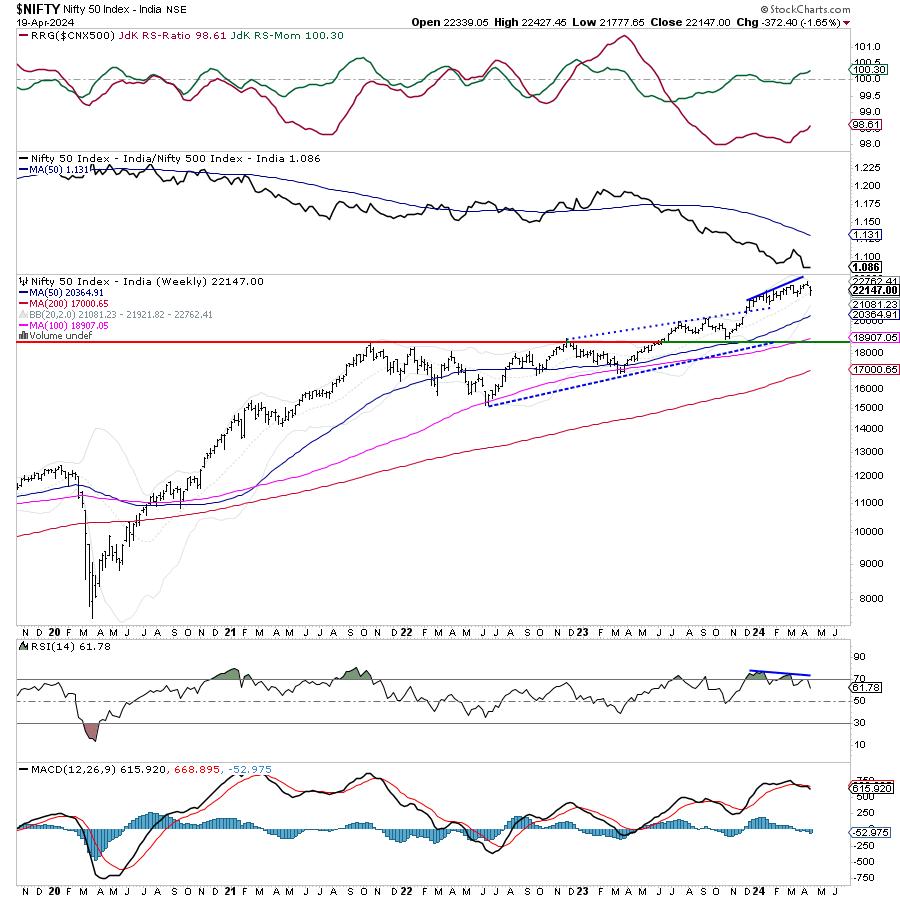
The weekly RSI is at 61.78; it has marked a new 14-period low which is bearish. It however stays neutral and does not show any divergence against the price. The weekly MACD is bearish and trades below its signal line.
The pattern analysis of the weekly chart shows that the last phase of the upmove on Nifty had come with a strong bearish divergence of the RSI against the price. While the Index moved higher forming higher highs, the RSI was seen forming lower tops which led to the emergence of the bearish divergence.
All in all, the coming week may see some continued technical pullback; however, at the same time, the markets continue to remain prone to face selling pressure at a higher level. It is also likely that apart from short-covering led bounces in the markets, it largely continues to display a risk-off sentiment. This could lead to defensive pockets like IT, Pharma, FMCG, etc., trying and display a better relative strength. Overall, it is strongly recommended that one must curtail leveraged exposures. While staying extremely selective, a highly cautious approach is advised for the coming week.
Sector Analysis for the coming week
In our look at Relative Rotation Graphs®, we compared various sectors against CNX500 (NIFTY 500 Index), which represents over 95% of the free float market cap of all the stocks listed.
Relative Rotation Graphs (RRG) show that the Consumption Index has rolled inside the leading quadrant. The Nifty Auto and Metal sectors are firmly placed inside the leading quadrant. Besides this, the Pharma and PSU Bank indices are also placed inside the leading quadrant but they are seen giving up sharply on their relative momentum. These groups are likely to relatively outperform the broader markets.
The Nifty Infrastructure and Commodities have rolled inside the weakening quadrant. The Nifty Energy, Midcap 100, PSE, and Realty Indices are also inside the weakening quadrant.
The Nifty IT and Media groups continue to languish inside the lagging quadrant. The Nifty FMCG index is also inside the lagging quadrant but it is seen improving on its relative momentum.
The Nifty Services Sector Index has rolled inside the improving quadrant. The Financial Services Sector Index and Banknifty are also inside the improving quadrant and may see improving relative strength over the coming days.
Important Note: RRG™ charts show the relative strength and momentum of a group of stocks. In the above Chart, they show relative performance against NIFTY500 Index (Broader Markets) and should not be used directly as buy or sell signals.
Milan Vaishnav, CMT, MSTA
Consulting Technical Analyst