


Strong Rotations on Daily RRG
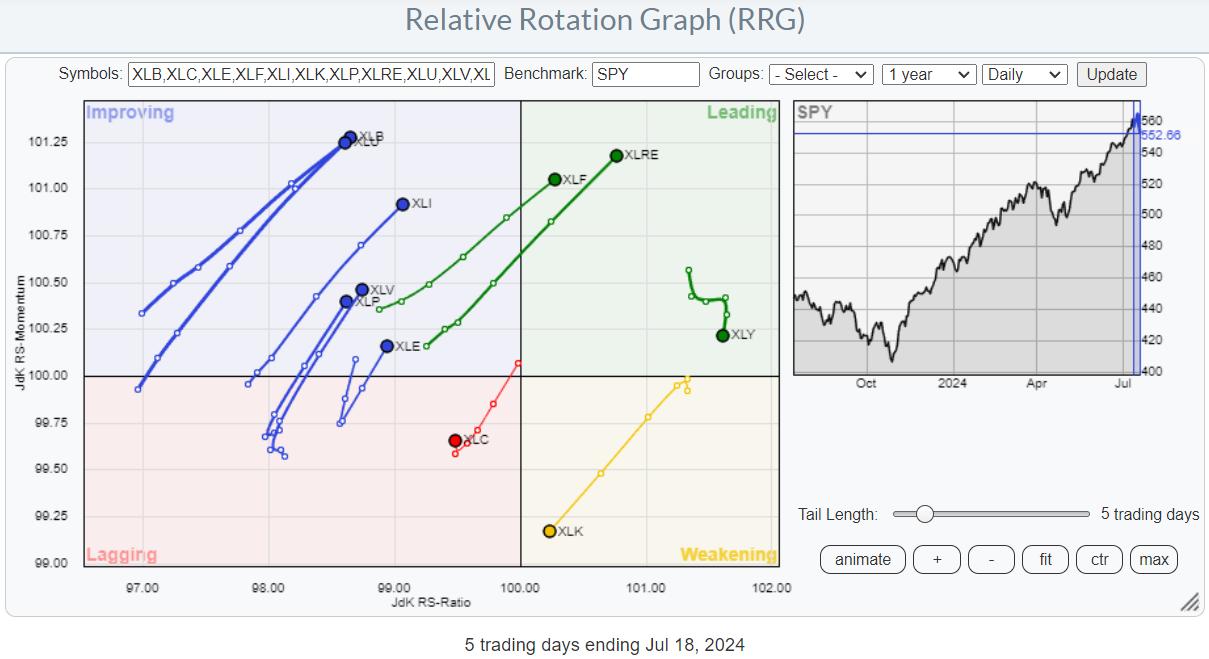
This daily RRG shows the sector rotation over the last five days. With only one more trading day to go (Friday, 7/19), the emerging trends are becoming clearer.
The only sector that has been driving the market higher is now the only sector inside the weakening quadrant, on a negative RRG-Heading and close to crossing over into lagging.
Consumer Discretionary is rolling over inside the leading quadrant, indicating that it is losing some of its recent strength. Communication Services is the only sector inside the lagging quadrant, but it is bravely attempting to curl back up.
All other sectors show long tails, indicating strength behind the move, and on a positive RRG-Heading either inside the improving quadrant or already inside leading.
Can The Weekly RRG Keep up?
Comparing this week’s rotations with those currently visible on the weekly RRG reveals some fairly opposite moves.
On the weekly RRG, XLK is still inside the leading quadrant, and only this week seems to be losing some relative momentum. Only Real Estate and CXonsumer Discretionary are also on a positive RRG-Heading but still low on the RS-Ratio scale.
All other sectors are on negative RRG-Headings.
We see now that the market capitalization knife is cutting on both sides. When technology stocks, especially semiconductors, rallied, the technology sector led the market higher. But we now see these same groups leading the charge on the downside.
This is the daily RRG showing the industries inside the technology sector. And you see that semiconductor and software stocks are pushing into the lagging quadrant against XLK as the benchmark. We have already seen how XLK is heading toward the leading quadrant.
The observation that the other industries inside technology are on a positive heading and improving or leading shows how heavy the impact of the weakness in software and semiconductors is on XLK’s move.
The table above shows how Semiconductors is the only group underperforming XLK in the last five days. Only computer services and telecommunications equipment stocks outperformed the S&P 500 index.
Technology Is A Drag
Hence, this heavyweight sector (XLK), led by its most important group (Semiconductors), is a big drag on the S&P 500.
This can be nicely visualized by a market carpet chart showing performance over the last five days.
Even though most sectors have shown positive returns over the period, XLK’s -3.17% drags the S&P 500’s performance down to minus 0.7%.
Market Cap is Truly a two-edged sword.
But how will this work out in the coming days/weeks?
The longer-term trend on the weekly RRG still shows Technology as the leading sector. When the price trend is also still moving upward, I would generally prefer to remain in the longer-term uptrend and watch for the shorter, daily tails to catch up and get back in sync with the weekly.
And this is where things are getting a little tricky. The price trend, certainly on the daily chart, got damaged.
The price gapped lower and closed below the rising support line, which marks the lower boundary of the rising channel that had been in play since April. Price is now resting at support near 222.40, the level of the previous low. While both the MACD and the RSI show a strong negative divergence.
The downward break from the channel is the first trigger that signals the execution of the negative divergence. The second and probably final trigger will be a break of support around 222.40.
When such a move occurs, and XLK starts to decline further, it will likely start to negatively affect the rotation on the weekly RRG and drag the XLK tail lower and out of the leading quadrant.
The sector’s upside potential is currently becoming problematic, with resistance levels in the gap area between 228.30 and 231.56. If support breaks, downside risk will open up.
The negative divergence on the SPY chart is even more pronounced. The support level to watch here is 550, while upside potential is limited to 555, and after that, the level of the rising support line of the former rising channel.
We are ,very likely, facing at least some sideways movement in the S&P 500.
The answer to “Will this be the beginning of something bigger?” will probably surface in the next few weeks.
#StayAlert –Julius