


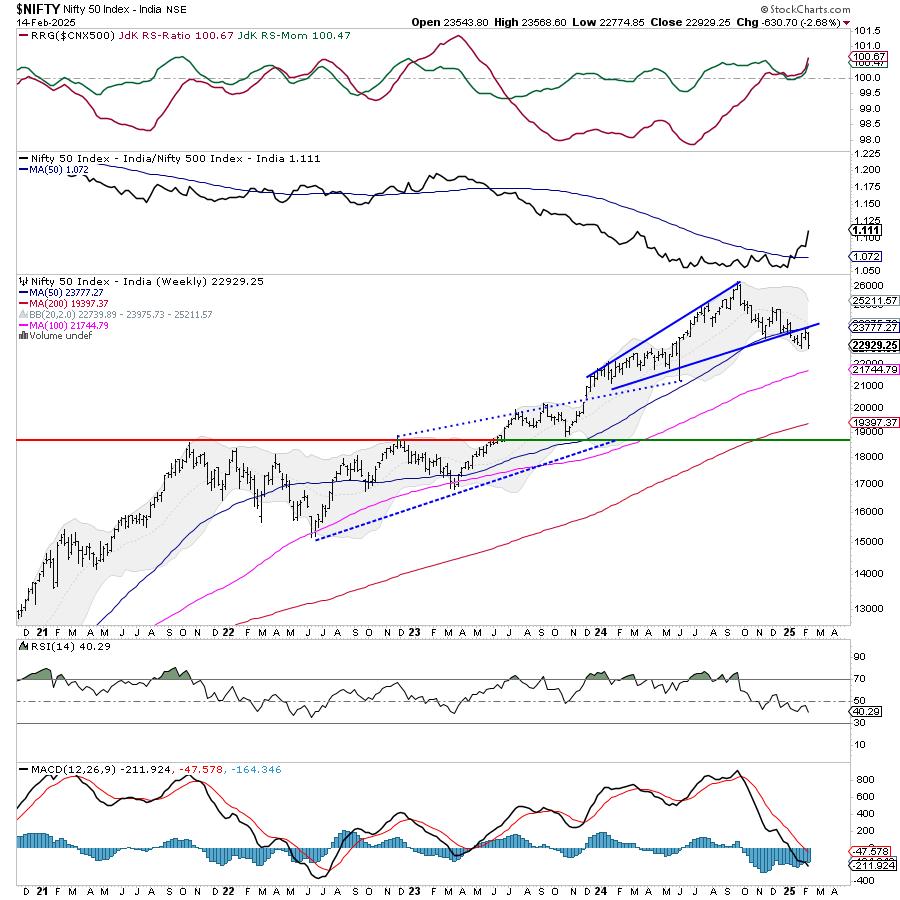
The Indian equity markets remained under pressure over the past five sessions, witnessing sustained weakness throughout the week. The Nifty50 faced resistance at key levels and struggled to find strong footing as it tested crucial support zones on two separate occasions. Market volatility surged significantly, with India VIX rising by 9.72% to 15.02, signaling heightened uncertainty. The index moved within a wider-than-usual trading range of 793.75 points, reflecting increased turbulence. By the end of the week, the Nifty had recorded a net weekly loss of 630.70 points, equivalent to a decline of 2.68%.
The upcoming week holds significant importance as the index approaches critical technical levels. The 22,800 mark is particularly crucial, as any decisive violation of this support is likely to invite further downside pressure. On the upside, strong resistance is expected at 23,500 and higher levels, making it unlikely for even the best technical rebounds to extend beyond this point. The market’s reaction to the 22,800 level will play a vital role in determining its short-term trajectory. A breach of this level could open the door to additional weakness, intensifying selling pressure.
Given the prevailing conditions, the new trading week may witness a subdued start. The immediate resistance levels are expected to emerge at 23,150 and 23,400, while key support levels are positioned at 22,700 and 22,450. These levels will serve as crucial markers in assessing the index’s directional bias over the next few sessions.
From a technical perspective, the Relative Strength Index (RSI) on the weekly chart stands at 40.40, forming a 14-period low and displaying a clear bearish divergence. This signals weakening momentum and suggests that market sentiment remains fragile. Additionally, the weekly Moving Average Convergence Divergence (MACD) indicator is bearish, as it trades below the signal line, further confirming the downtrend.
A detailed pattern analysis indicates that the Nifty faced resistance at the 50-week moving average and subsequently resumed its downward movement. The inability to sustain gains above this crucial moving average reinforces the broader weakness in the market structure. If the index slips below 22,800, it could trigger further declines, potentially leading to deeper corrections in the near term.
Market participants should approach the coming sessions with heightened caution, considering the overall technical setup. The 22,800 level remains a key pivot, and any decisive breach could accelerate selling pressure. Given the prevailing conditions, it is advisable to use any technical rebound as an opportunity to protect profits rather than aggressively chase fresh long positions. New buying should be undertaken selectively, with a strong emphasis on risk management. Leveraged exposures should be kept at modest levels to navigate the increased volatility effectively. With market sentiment appearing fragile and downside risks persisting, a highly cautious approach remains warranted in the near term.
Sector Analysis for the coming week
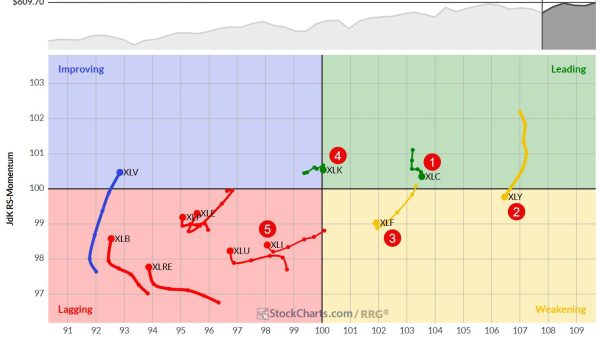
In our look at Relative Rotation Graphs®, we compared various sectors against CNX500 (NIFTY 500 Index), which represents over 95% of the free float market cap of all the stocks listed.
Relative Rotation Graphs (RRG) show that the Nifty Financial Services index has rolled back inside the leading quadrant. Besides this, the Nifty Bank Index is the only index that is inside the leading quadrant. These groups may continue to outperform the broader markets relatively.
The Nifty Services Sector Index and the Pharma Index are inside the weakening quadrant. However, they are seen improving on their relative momentum. Apart from this, the Midcap 100 and the IT index are inside the weakening quadrant.
The Media Index continues languishing inside the lagging quadrant along with the PSE and the Realty Index. They may relatively underperform the broader markets. The Energy Sector Index is also inside the lagging quadrant, but its relative momentum is improving.
The Nifty Commodities, Consumption, FMCG, Auto, and the Metal index are inside the improving quadrant. They may continue improving their relative performance against the broader markets. The PSU Bank index is also inside the improving quadrant, but it is seen sharply giving up on its relative momentum, and it is expected to underperform the broader Nifty 500 index relatively.
Important Note: RRG™ charts show the relative strength and momentum of a group of stocks. In the above Chart, they show relative performance against NIFTY500 Index (Broader Markets) and should not be used directly as buy or sell signals.
Milan Vaishnav, CMT, MSTA
Consulting Technical Analyst