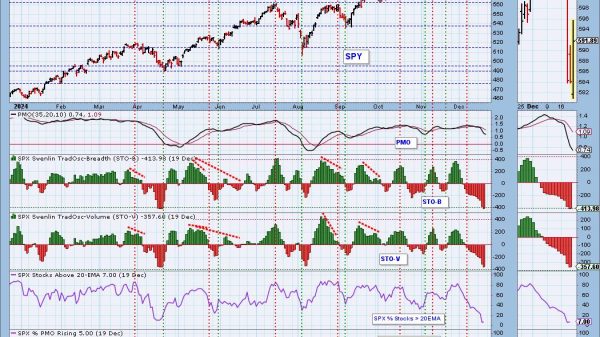
Stocks surged this week with the S&P 500 SPDR (SPY) advancing over 5% and nearing its falling 200-day SMA. The big trend is still down because SPY recorded a 52-week low a month ago and a lower low from June to October. The ETF also remains below its falling 200-day SMA. Following my process at TrendInvestorPro, SPY remains off limits because it is in a downtrend and not showing relative strength. Chartists looking for real strength should focus on ETFs that held above their summer lows in October and are already above their 200-day SMAs. These are the real leaders that warrant our attention.
The chart below shows the Biotech ETF (IBB) with these leading characteristics. Notice how the ETF held well above its summer lows in September, which is when SPY was hitting new lows. IBB then broke out of a falling channel and broke the 200-day SMA in late October. SPY, in contrast, is still below its 200-day SMA. IBB sports a bullish chart and shows upside leadership. The October lows mark support and a close below these lows would argue for a re-evaluation.
The indicator window shows the percentage difference between the close and the 200-day SMA with horizontal lines at +3% and -3% (TIP Indicator Edge Plugin). These lines are used to filter signals and further qualify breaks of the 200-day, which will reduce whipsaws. An upside break is deemed valid when the close is more than 3% above the 200-day. The same applies for a downside break. The long-term uptrend is considered valid until the close is more than 3% below the 200-day.
Despite a bear market environment for most of 2022, TrendInvestorPro continues to focus on ETFs showing upside leadership and strong price charts. ETFs relative to healthcare, energy and defense have these characteristics – and more recently we are seeing strength in metals. Click here for immediate access to our reports, videos and strategy articles.
The Percent Above MA, Trend Composite, ATR Trailing Stop and eight other indicators are part of the TrendInvestorPro Indicator Edge Plugin for StockCharts ACP. Click here to learn more and take your analysis process to the next level.
—————————————


